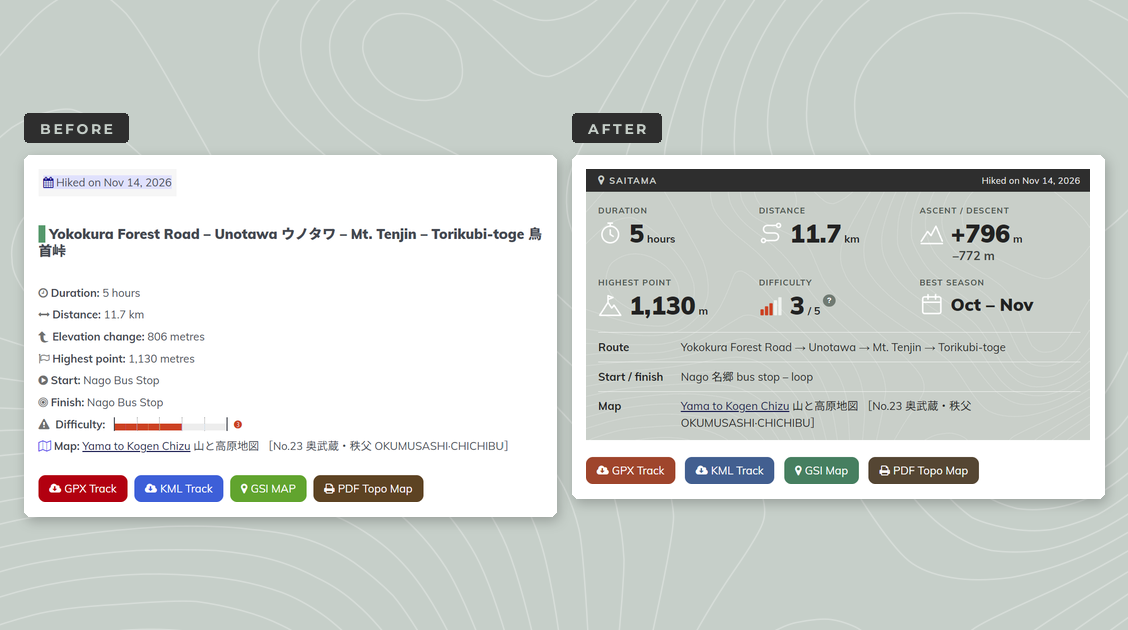
A New Look for Ridgeline’s Hiking Guides
Thirteen years of hike reports get dragged, kicking and screaming, into the present day.
If it ain’t broke, why fix it? It’s a question I suspect a lot of long-time bloggers ask themselves, and for years it was my answer as well. My hike reports have looked much the same since I started Ridgeline Images back in 2013. A few colours and icons have come and gone, but the basic formula of a stats box, a map reference and a long run of text hasn’t really changed a ton.
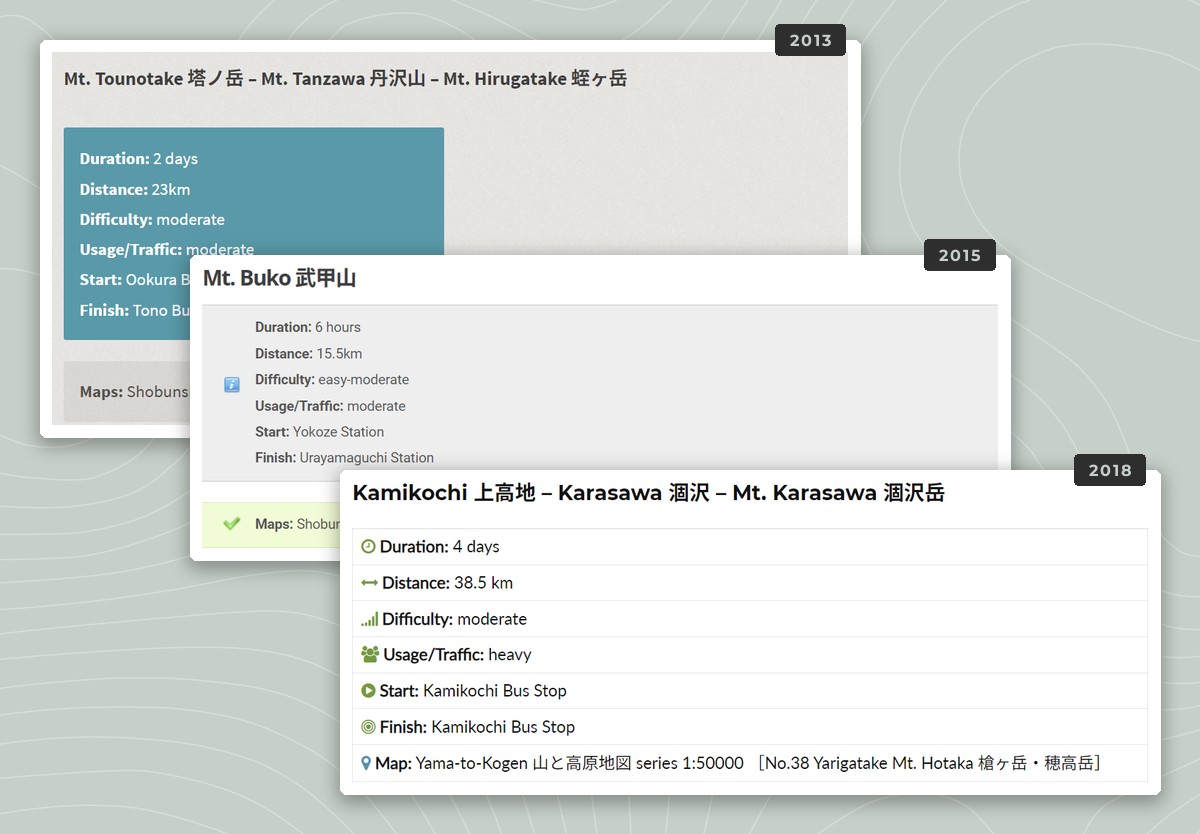
Old stats boxes, 2013–2018.
Over the weeks ahead, that’s changing; in fact, the process has already started with my latest hike report, Unotawa, which you may have noticed. I’ll be rolling out a new layout across all of my roughly 190 hike reports. This post explains why I’m doing it and what you can expect.
Why Change Now?
The way people find hiking information is changing fast. Search engines increasingly answer questions directly with AI-generated snippets, meaning fewer people click through to the sites those answers are built on. Most blogs and websites are already feeling the effects. New visitors are harder to come by than they used to be, and when someone does land on one of my pages, I want to do everything I can to make them stick around.
A nice design isn’t the be-all and end-all. Good information still matters most. But a clean, consistent layout tells a visitor that the page is looked after and that the information on it can be trusted. For a hiking blog, where people use my guides to plan their days in the mountains, getting the details right is pretty important.
Designed the Way I Like to Read a Hike Report
I’ve visited a lot of hiking blogs and websites over the years, both in English and Japanese, and I’ve seen what works and what doesn’t. Too often, the basics – where the hike starts, how long it takes, how to get there – are buried somewhere in the middle of several paragraphs (guilty as charged!).
So I’ve designed the new layout the way I like information to be displayed. Whenever I read about a hike, I’m really trying to answer two questions: do I want to do this hike, and is there enough reliable information to do it safely? The new layout is built around answering both at a glance, in a logical order, without having to dig too deep.
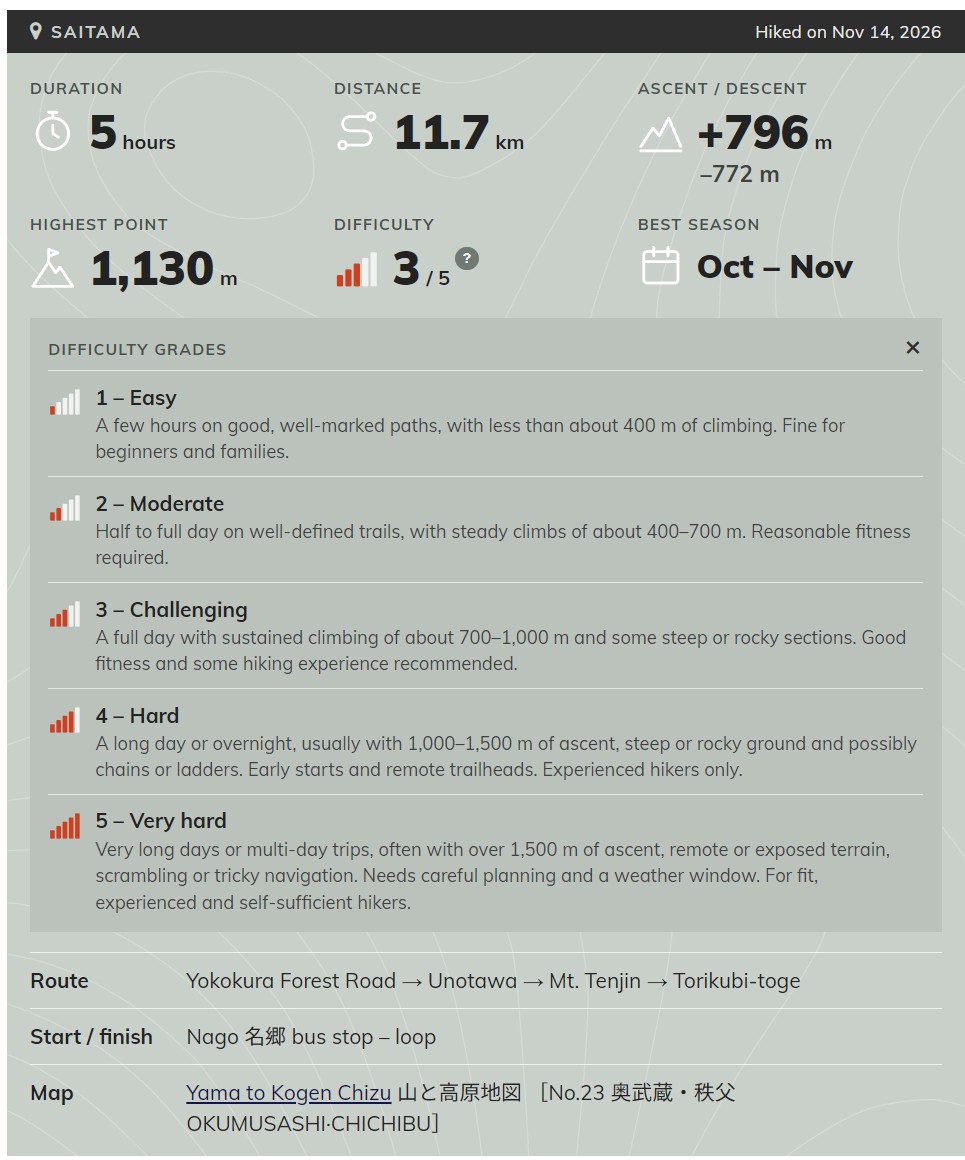
The new stats panel, with the difficulty key open.
What’s New
The stats panel. The key details now sit together at the top of each report: the route, duration, distance, ascent and descent, highest point, start and finish, difficulty and the relevant paper map, with a subtle contour effect on the background.
Best season. Each report now lists the months I consider best for hiking each route.
Difficulty grades explained. In the whole time writing this blog I’d never actually explained what my difficulty grades mean. Click the “?” beside the difficulty rating and a short key will open, explaining all five grades from Easy to Very hard.
Navigation notes up front. Where there’s something you should know before setting out, such as a faint or easily missed section of trail, it’s now flagged near the top of the report rather than tucked away in the text.
A dedicated access section. Getting there used to be covered in the opening paragraph. It now has its own section, including train fares and when they were last checked, so you can tell at a glance how current the information is. I’ve stopped linking to bus timetables, as those links always seem to expire sooner or later.
Downloads and route map. The free GPX, KML and PDF topo downloads are still there, together with a link to the GSI map. They’re now presented in a tidier set of buttons, with the embedded route map and elevation profile below.
Keeping Things Lightweight
I won’t get too far into the weeds, but suffice to say, the new layout is built with lightweight custom HTML and CSS. There are no resource-hungry page builders like Elementor. Pages should load quickly, which matters when you’re checking a route on a dodgy signal at a trailhead, and the layout adapts to smaller screens, so everything stays easy to read on a phone.
The Rollout
I’ll start converting reports in December, beginning with the most recent and working backwards. That way, the reports most likely to be read are updated first, and the transport information stays as accurate as possible.
It’s a big job, so for a while you’ll see a mix of old and new layouts around the site. Please bear with me. Every report I convert also gets a once-over, so it’s a good chance to catch anything that’s gone out of date.
One more change, for email subscribers: the newsletter will now send an excerpt of each new post with a link to read the rest on the site, rather than the full post. The new layout doesn’t display properly in email, and I’d rather you saw it the way it’s meant to look.