
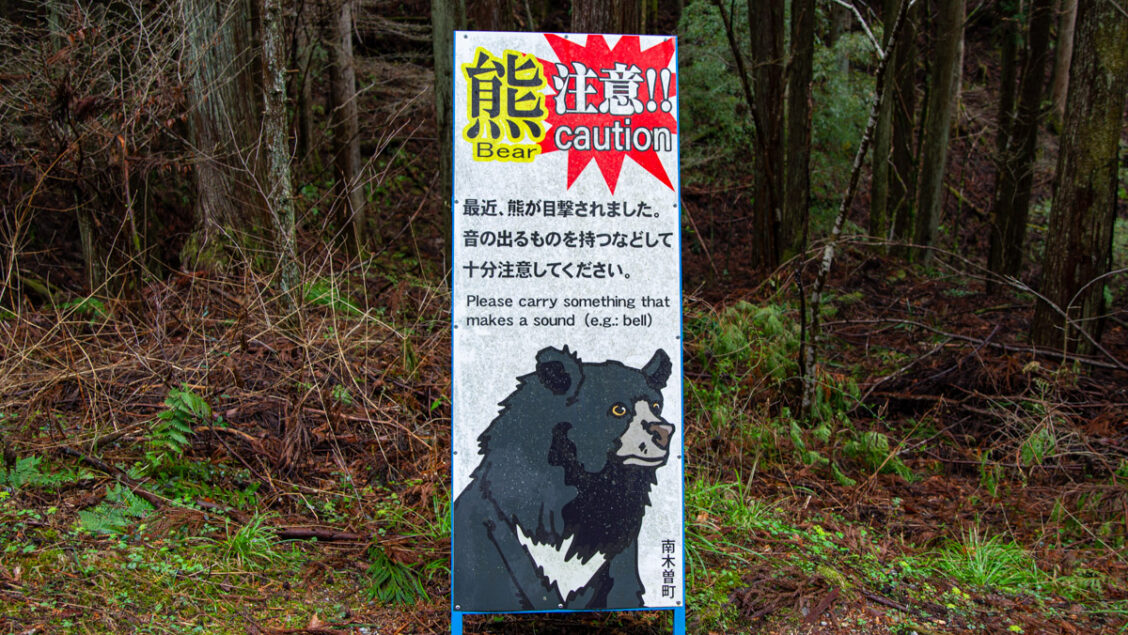
Why a Map of Bear Reports Isn’t a Map of Bear Risk
More hikers and news outlets are now pointing people to Kumamap, a multilingual map of bear reports from across Japan. ABC News Australia profiled it in June, and CNN featured it in September in a report on how Japan is using technology to tackle bear encounters. The site’s homepage claims nearly 7.5 million ‘active users’. That appears to be a cumulative figure since launch rather than a monthly count; CNN reported ‘nearly 6 million users’ in early August. It also says it is cited in ‘peer-reviewed research’. That’s reason enough to look closely at what it shows and what it claims.
Anyone who has tried to check bear reports before a hike knows the appeal. Prefectural bear information is scattered, mostly in Japanese, and published in formats that don’t always align with each other. Gathering it in one place, in English, is a genuinely useful idea. My problem is what Kumamap does with it.
What is an ‘incident’?
The whole site rests on one word, and I couldn’t find a definition of it anywhere. Kumamap uses ‘incidents’ and ‘sightings’ interchangeably. The Nagano page is titled ‘Nagano Black Bear Incidents’, describes its contents as ‘sighting and incident data’, and its own FAQ asks when the latest incident was, then answers with the most recent sighting. The data page counts 164,420 ‘incidents’ (as at 24 October 2026) and breaks them down by source, species, year, month and place, but not by what actually happened. I’m not the only one bothered by it. Under the Nagano page, a reader called Jason put it plainly: ‘A sighting isn’t an incident’. To him, an incident means a bear making contact with a home, a vehicle, food or a person. Three months on, nobody has replied.
Switch the site to Japanese and the problem comes into focus. There, the same records are labelled shutsubotsu, a broad, neutral term used in Japanese bear statistics for reports of bear appearances. In English, Kumamap renders this as ‘incident’, a word that suggests something more consequential has happened.
Judging by the entries, an incident can be a bear seen from a car in a rice field, a ‘bear-like animal’ at a sports ground, claw marks on a loquat tree, or a bear caught in a snare and culled. A worker attacked from behind on a forest road in Nikko and a hiker seriously injured in Okutama in May sit in the same lists. One Okutama route page counts an emergency culling drill among its ‘12 bear sightings’, logged as one black bear, and advises readers to consider rescheduling. Nothing in the counts tells a drill from a bear.
From Counts to Colours
Kumamap turns those counts into five risk ratings, from Safe through Low, Moderate and High to Very High Risk, but the method isn’t published, and the ratings sit oddly beside the numbers shown with them. Takayama displays 6,613 incidents and is rated Low Risk; Mt Takao displays 320 and is rated Moderate Risk. The ratings appear to reflect the last 30 days (5 reports in Takayama, 25 on Takao) rather than the cumulative totals displayed on the same page. If that’s the method, the pages don’t explain it. The commentary doesn’t always agree with itself either. The Takao-san Yakuo-in page says reports are up on the previous week, and further down the same page says activity has slowed.
The route tool is stranger. Kumamap publishes users’ saved trip plans as public ‘trip reports’, each with its own risk rating and templated advice. One ‘hiking route’, titled as a walk from Meiji no Mori Takao Quasi-National Park to Mount Takao, actually runs 962 km to Mount Akita-Komagatake and back, with an absurd estimated time of 13 minutes. It is rated Very High Risk, described as ‘an active bear corridor’, and readers are strongly advised to reroute or reschedule. Its timeline files bears in Fukushima and Yamagata under its Takao starting point.
Closer to home, the Okutama route with the culling drill is rated High Risk on the strength of its 12 ‘sightings’. The Okutama area page, drawing on the same reports, rates the town Low Risk.
Geography
Kumamap assigns reports to places by distance: anything within 12 km counts towards a hiking area, and within 18 km towards a tourist spot. That produces some odd results. Mt Takao, filed as a hiking area, shows 320 reports; Takao-san Yakuo-in, just below the summit but filed as a tourist spot, shows 828. Kubota Castle, in central Akita city, shows 7,400 reports on one page and 1,603 on another, depending on which kind of page you land on.
A radius on a flat map takes no account of ridgelines, valleys or where people actually walk. A bear seen in a farming valley 12 km away, on the far side of a 2,000-metre ridge, still counts towards a summit’s total, even though hikers on its trails are unlikely ever to cross the bear’s path.
And however they’re placed, raw counts can’t tell you how likely you are to meet a bear. That depends on how many people use a trail, when and how they walk it, and none of that is on the map. A count tells you where reports have been filed, not how dangerous a trail is.
‘Complete’ and ‘Community’
Kumamap bills itself as ‘The Most Complete Bear Data in Japan’. Bigger isn’t the same as more complete, though. Its creator told ABC News that the database sometimes counts the same incident more than once. On the Okutama page, I found six entries for a single attack on a hiker in May, listed under different spellings and place names.
As for community, the data page puts community reports at 1,026 of 164,420 records, or 0.6 per cent. Almost 93 per cent are official records, and most of the rest are news items collected automatically. It describes the official records as ‘verified reports’ from prefectural environmental departments, but that means a prefecture published them, not that Kumamap checked them. Community reports are said to be reviewed before publishing, yet one on an Okutama route page went live with the submitter’s own email address left in the text (which I’ve reported through the site’s own form), even though the About page says reports are anonymous and only location data is made public.
The ‘peer-reviewed research’ claim is less impressive on closer inspection. The cited work is a short ‘Science Behind the News’ commentary in Global Change Biology, which credits Kumamap once as the data source for a pair of pie charts showing reports by species and prefecture. The bear data the authors actually analysed came from Akita Prefecture’s own open data. Using a site’s data for an illustrative chart is not the same as validating its database or methodology.
Commercial Placement
Affiliate income isn’t a problem in itself, and the pages disclose it: a line beneath the product listings says Kumamap earns from qualifying purchases as an Amazon Associate and Rakuten affiliate. The issue is where those listings sit. On a safety site, the same pages that tell you how dangerous an area is also sell products intended to protect you from it. Area and route pages pair their risk ratings and warnings with a ‘Hiking in bear country’ section of affiliate links to bear sprays, bells and horns. The Okutama route page that advises readers to consider rescheduling carries the same links. Even the record of the culling drill comes with eight bear-deterrent products, starting with a bear spray priced at 9,000 yen.
That creates a potential conflict of interest, whether or not anyone acts on it. A site that earns affiliate revenue from safety products has a commercial incentive to encourage purchases. I’m not suggesting the ratings are set to sell bear spray, and I’ve seen nothing to show that. But when the warnings and the shopping links share a page, readers can’t easily tell where safety guidance ends and sales promotion begins.
How I’d Use It
Treat Kumamap as an index, not the final word. Use it to find reports near your destination, then follow the source links to the original prefectural or municipal notices. These will usually be in Japanese, but a translation tool should make them accessible. In Tokyo, the metropolitan government’s own map, TOKYO Kumap, distinguishes between sightings, traces, camera footage and captures. I wouldn’t rely on Kumamap’s colour ratings or route risk scores to make a safety decision. Before a hike, ask the local visitor centre, mountain hut or tour operator what’s happening on the ground.
A site that wants to be trusted with safety information should define what an incident is, publish how its ratings work, identify and remove duplicates, and distinguish a sighting from an attack and a bear near a road from one on a trail. Until then, Kumamap is a convenient map of reports, not a measure of risk.
This review reflects the site as it stood on 24 October 2026. I haven’t contacted Kumamap. If it publishes definitions or a method for its ratings, I’ll update this post.

Should one report bear skat at a farm in a mountainous area? To me, it seems like a persimmon tree needs cutting or a fig tree for example in the yard. This happened at two locations I’m familiar with.
Both places are surrounded by mountains where bears live. The trees have been or will be cut to deter the bears and also Hakubishin (who loooove figs).
Thanks, Amy, good question. Yes, it’s worth reporting bear scat near homes or farms to the local town or city office. Municipalities often record scat and claw marks separately from sightings to help track bear activity. Removing unharvested persimmons and figs is a sensible step too.
Thank you. Will do. I did report the Hakubishin and was told there was a waiting list and in the meantime told to do what I could to encourage them to leave. I cut plants, fruit trees and scattered stinky bags in the attic. They seem to have left so have to look for holes. Looking forward to your other articles!
Hi David, I couldn’t agree with you more. I checked out the site when it first appeared and soon saw that it’s quite useless for anyone planning to hike in an area. Bears move around a lot and quickly, up to 10km a day, and have a home range of around 40 to 70 sq km according to AI, so the information on bear sightings is out of date before it’s published. It’s kind of interesting that that are so many thousands of ‘ incidents’ of bears and only a relatively few attacks on humans. That tells me that most bear incidents end with the bear retreating or ignoring humans that see them. Black bears can be found all over Honshu and Hokkaido but the rogue bears that attack people seem to be more on the outskirts of certain villages and cities and not where most hikers go. More useful and important information would be to know where rogue bears have been attacking people are located, so as to avoid those areas.
Thanks for reading, Phil, and some good points, especially on home ranges. A sighting from last week tells you a bear was around, not where it is today. You’re right that most encounters end with the bear moving off, and that many attacks happen around villages and farmland rather than on trails, though the Okutama attack in May shows hikers aren’t immune.
For me, the key questions remain how the site defines an incident versus a sighting, and how those risk ratings are worked out.
Many thanks for this thoughtful and well-researched deep dive, David. The takeaway is that Kumamap’s input data haven’t been screened, sifted or cleaned, so that it could give a meaningful indicator of actual risk. That most certainly needs to be kept in mind when planning a trip. But Phil, in his comment above, has put his finger on a further issue: the considerable variability of bear behaviour (and let’s not even start on the variability of human behaviour when in the proximity of bears). All this would make it extremely difficult to come up with a meaningful area-by-area risk indicator, however much the data are sifted, screened, cleaned etc… So I guess it’s back to the bear bell, and hike in company if possible. And always walk, don’t run, when in the ursine ‘hood.
That’s well put, PH. One thing I’d add is that some of the most useful signals are the ones a map can’t capture properly: a trail closure, a recent notice at the trailhead, or several reports along the same route in the past week. When a town closes a route, as happened in Okutama after the attack in May, that’s a decision made by people in the know. I’d take that more seriously than any colour-coded risk rating.
Totally agree with your comments, I find the site worse than useless. I live in rural Hanno, known bear country, but I’ve never seen one in 43 years on my daily hike. The prefecture really needs to get its act together, as bears will only increase in numbers, culling or removal to habitat far from humans.
Thanks, David. Forty-three years of daily hikes in Hanno without a single sighting is quite something, even in known bear country. With bear numbers rising, it’ll be interesting to see how Saitama and the other prefectures manage things in the years ahead.