GSI Topo Maps: A Beginner’s Guide
In this previous article I described in some detail the finer points of reading “Yama to Kogen Chizu” topographic maps, this time we turn our attention to the Geospatial Information Authority of Japan (GSI) and notably their detailed 1:25,000 topographical map series that covers the entire country. These survey maps serve as a basis for establishing land boundaries and roads though are also invaluable for hikers looking to glean information about the terrain, natural features, and man-made structures depicted by the surveyors.
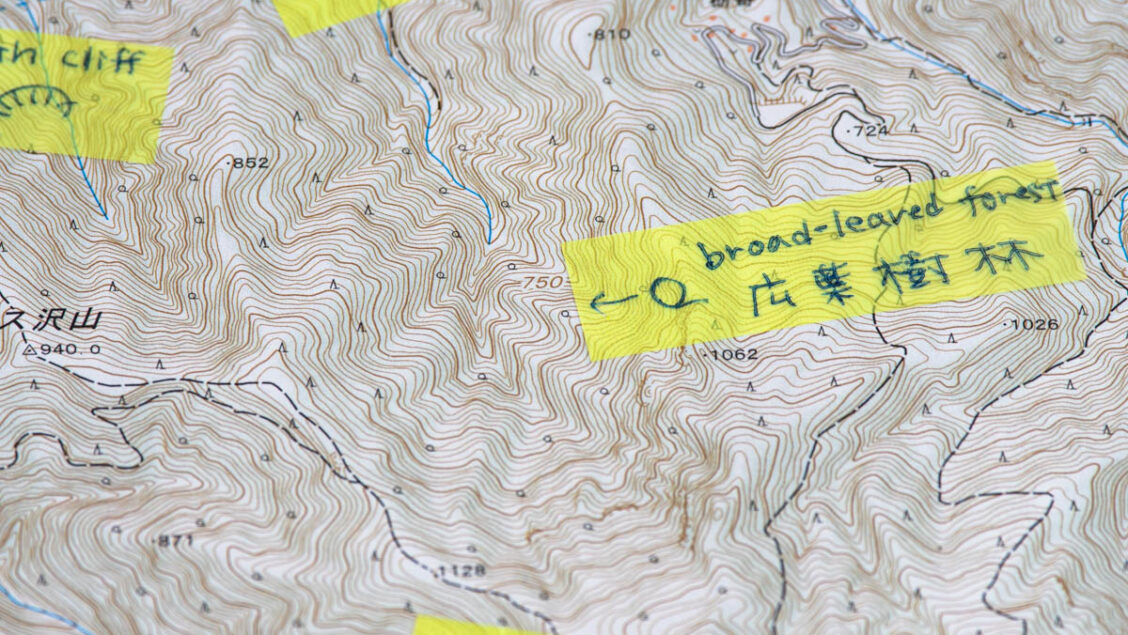
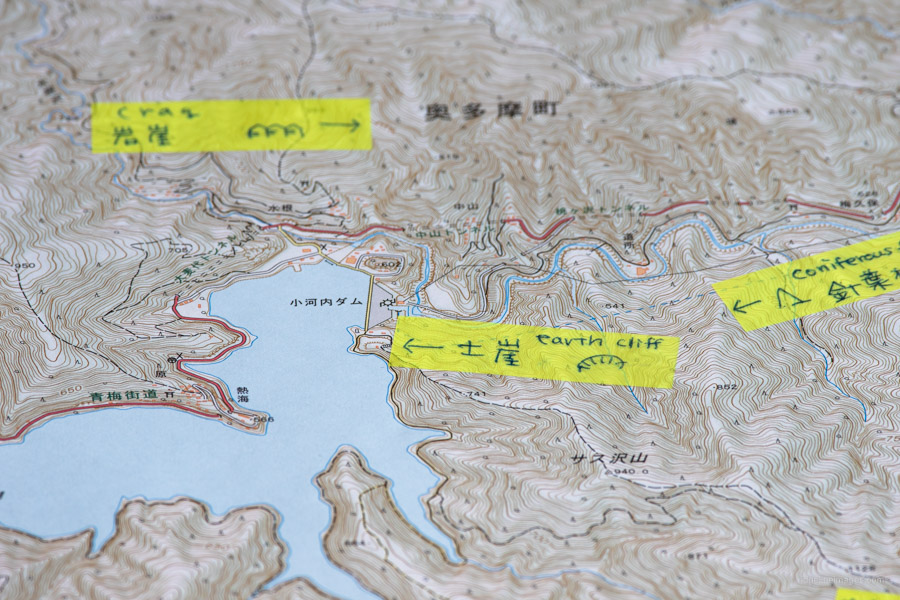
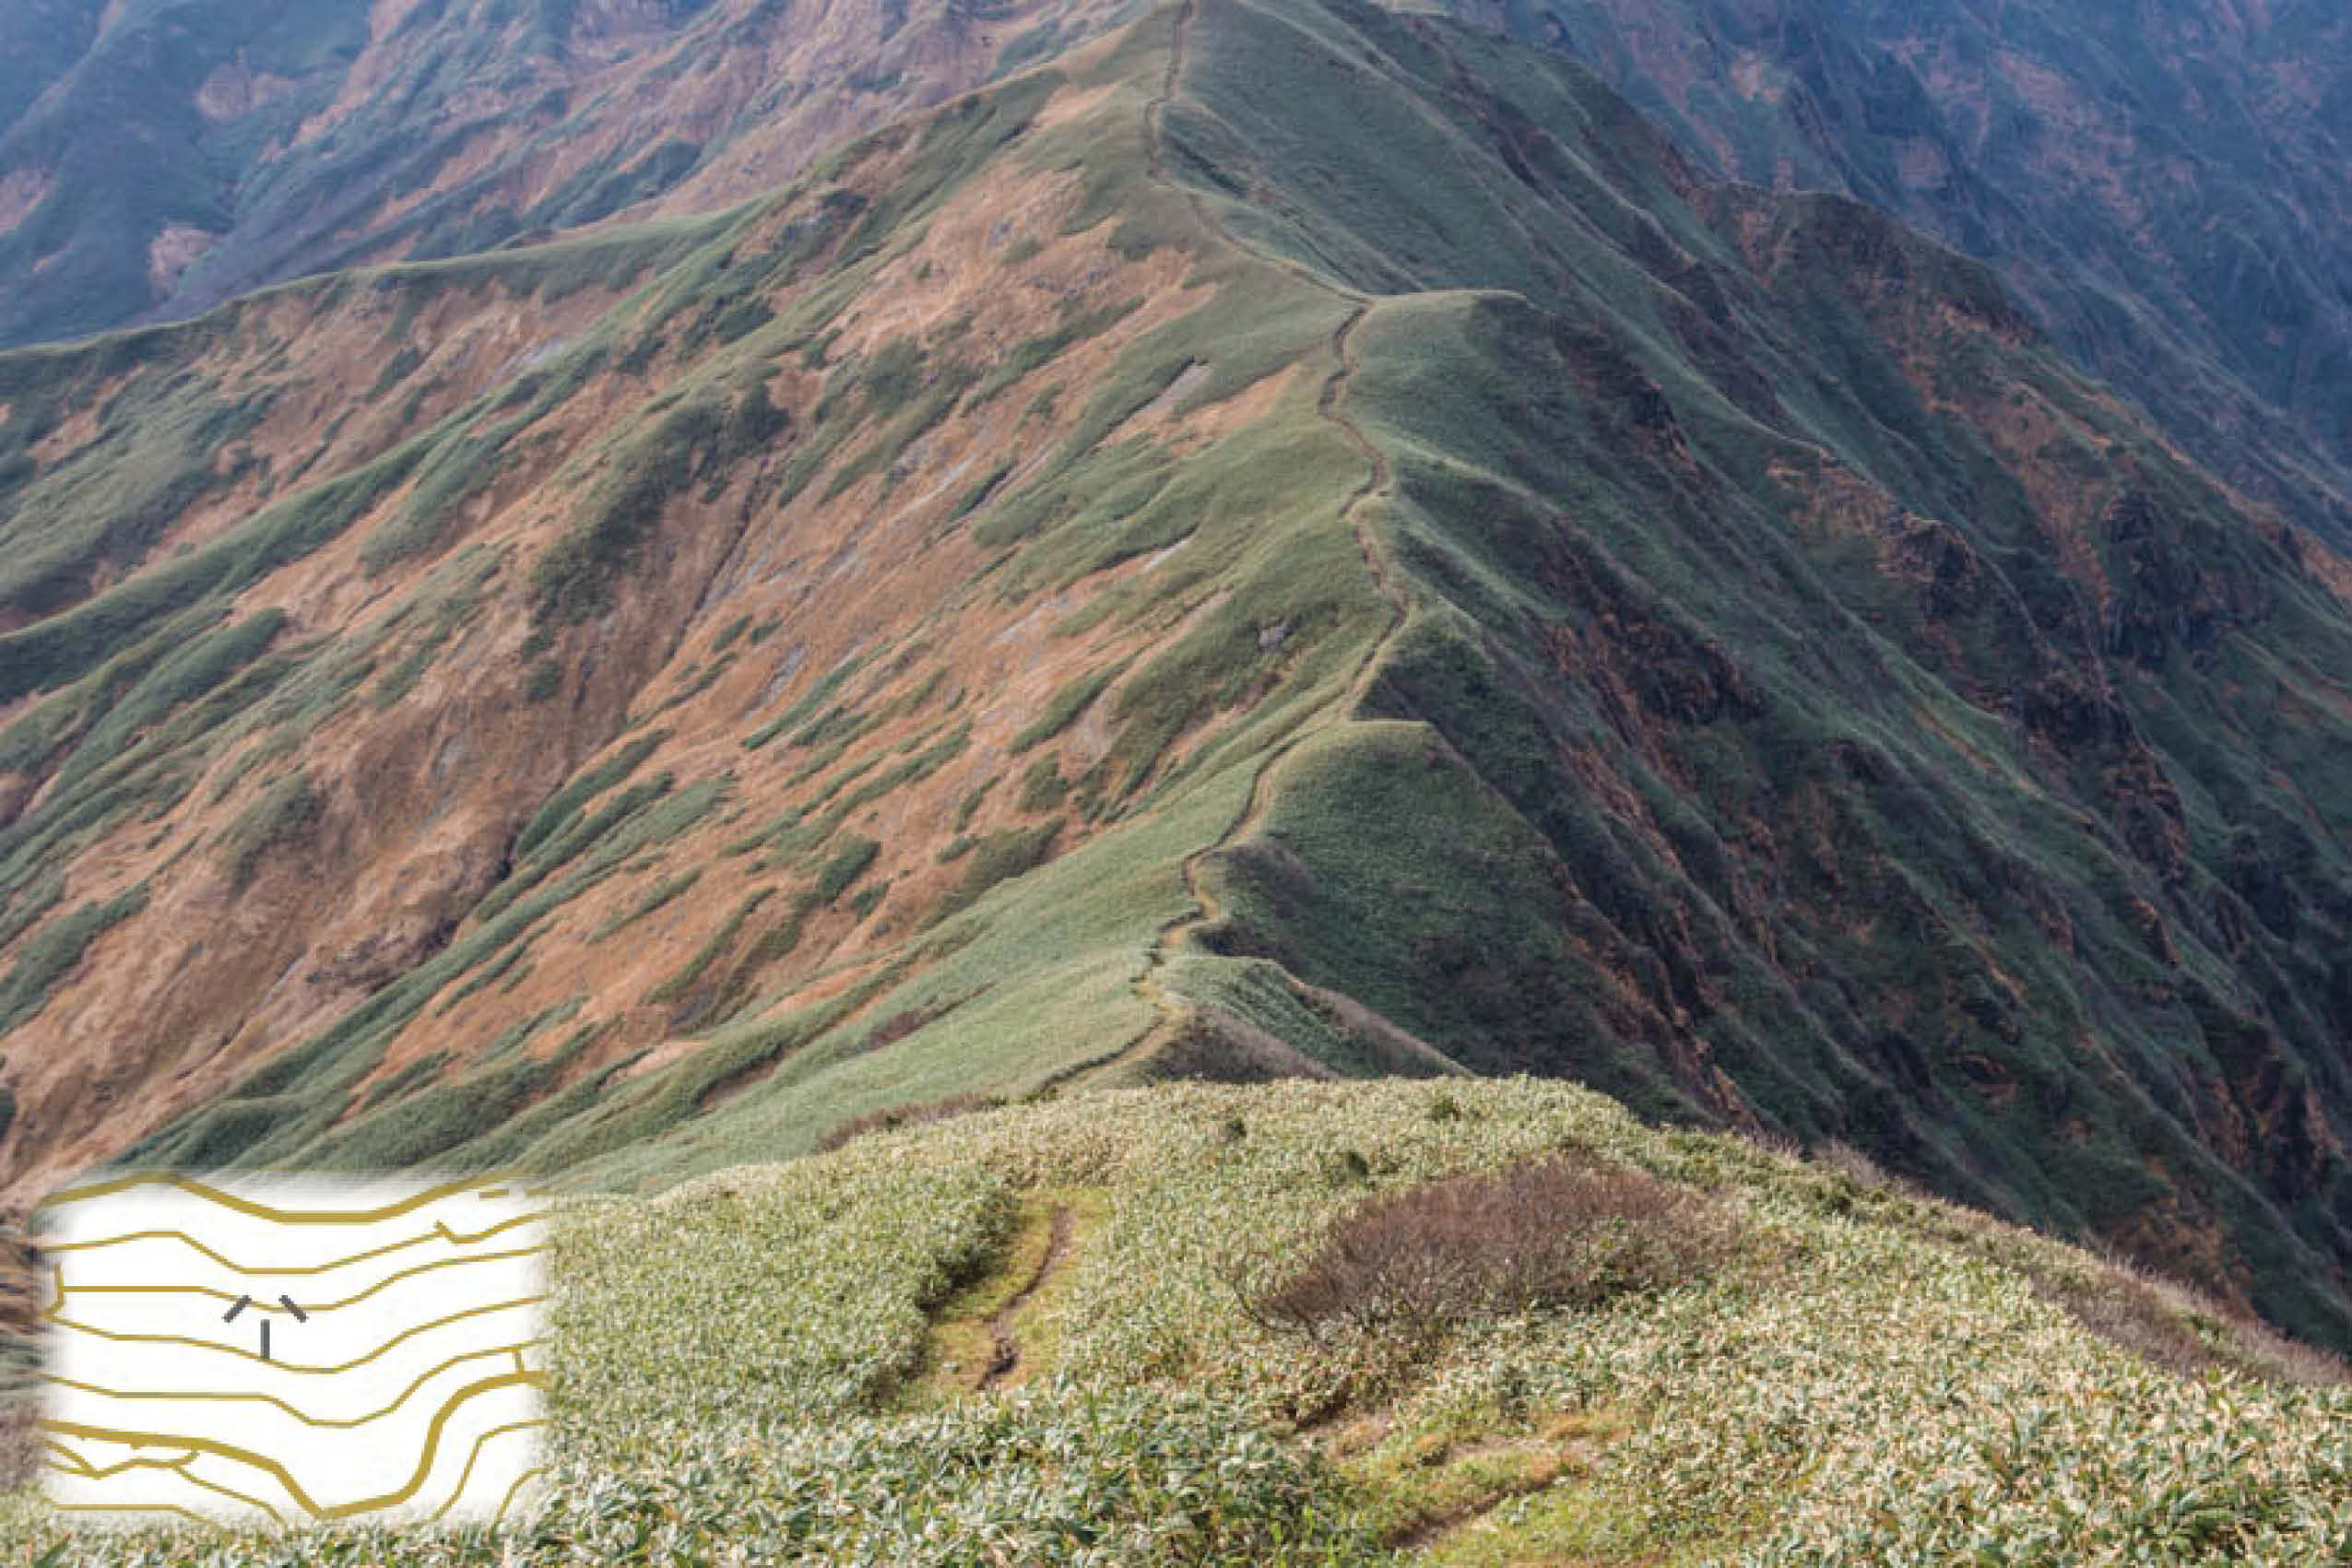
While GSI publishes maps at a variety of scales, the focus here are the 1:25,000 topo maps, where 1 centimetre on the map represents 25,000 centimetres, or 250 metres, on the ground. In particular, I have tried to hone in on the topographic map legend and symbols GSI uses to represent vegetation, landforms, landmarks, water bodies and paths. Decoding this iconography isn’t immediately intuitive, with a lopsided ‘Q’ representing broad-leaved forest and an inverted ‘V’ for coniferous forest. However, understanding the symbols and recognising them out on the trail offers up clues to better navigate our surroundings.
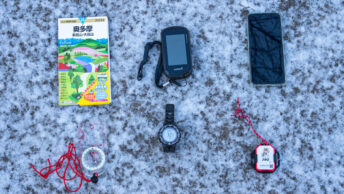
So, which one is ‘best’—the GSI or Yama to Kogen map? Most of the time, it’s sufficient just to carry the Yama to Kogen Chizu which is geared towards recreational climbing. They are updated annually, include information on the location of water sources, campsites, and course times, are compact when folded up, and are made from water- and tear-resistant paper. The GSI map sheets, on the other hand, are useful when the hike falls outside one of the Yama to Kogen map sheets or in situations where you need the extra detail of a small-scale map. The contour lines are easy to see, packs in far more detail and are significantly cheaper (435 yen) for multicoloured and a bit less for the former three-coloured maps vs. 1,100 yen for Yama to Kogen Chizu). Both map styles are readily available at large bookshops and outdoor stores.
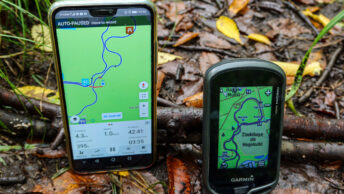
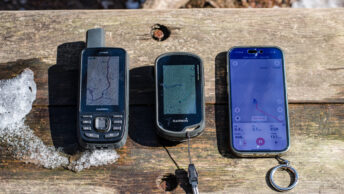
The GSI maps are less focused on hiking and more on conventional navigation, which requires a knack for reading them, hence the rationale behind writing this blog post, which can make hiking more enjoyable and perhaps lessen the possibility of getting lost. Paper maps are best used in conjunction with a handheld or smartphone-enabled GPS device with preloaded topographic maps.
Contents
Vegetation Features
Landforms Features
Water Bodies
Buildings and Landmarks
Roads and Trails
Navigational Aids not Shown on GSI Maps
Vegetation Features
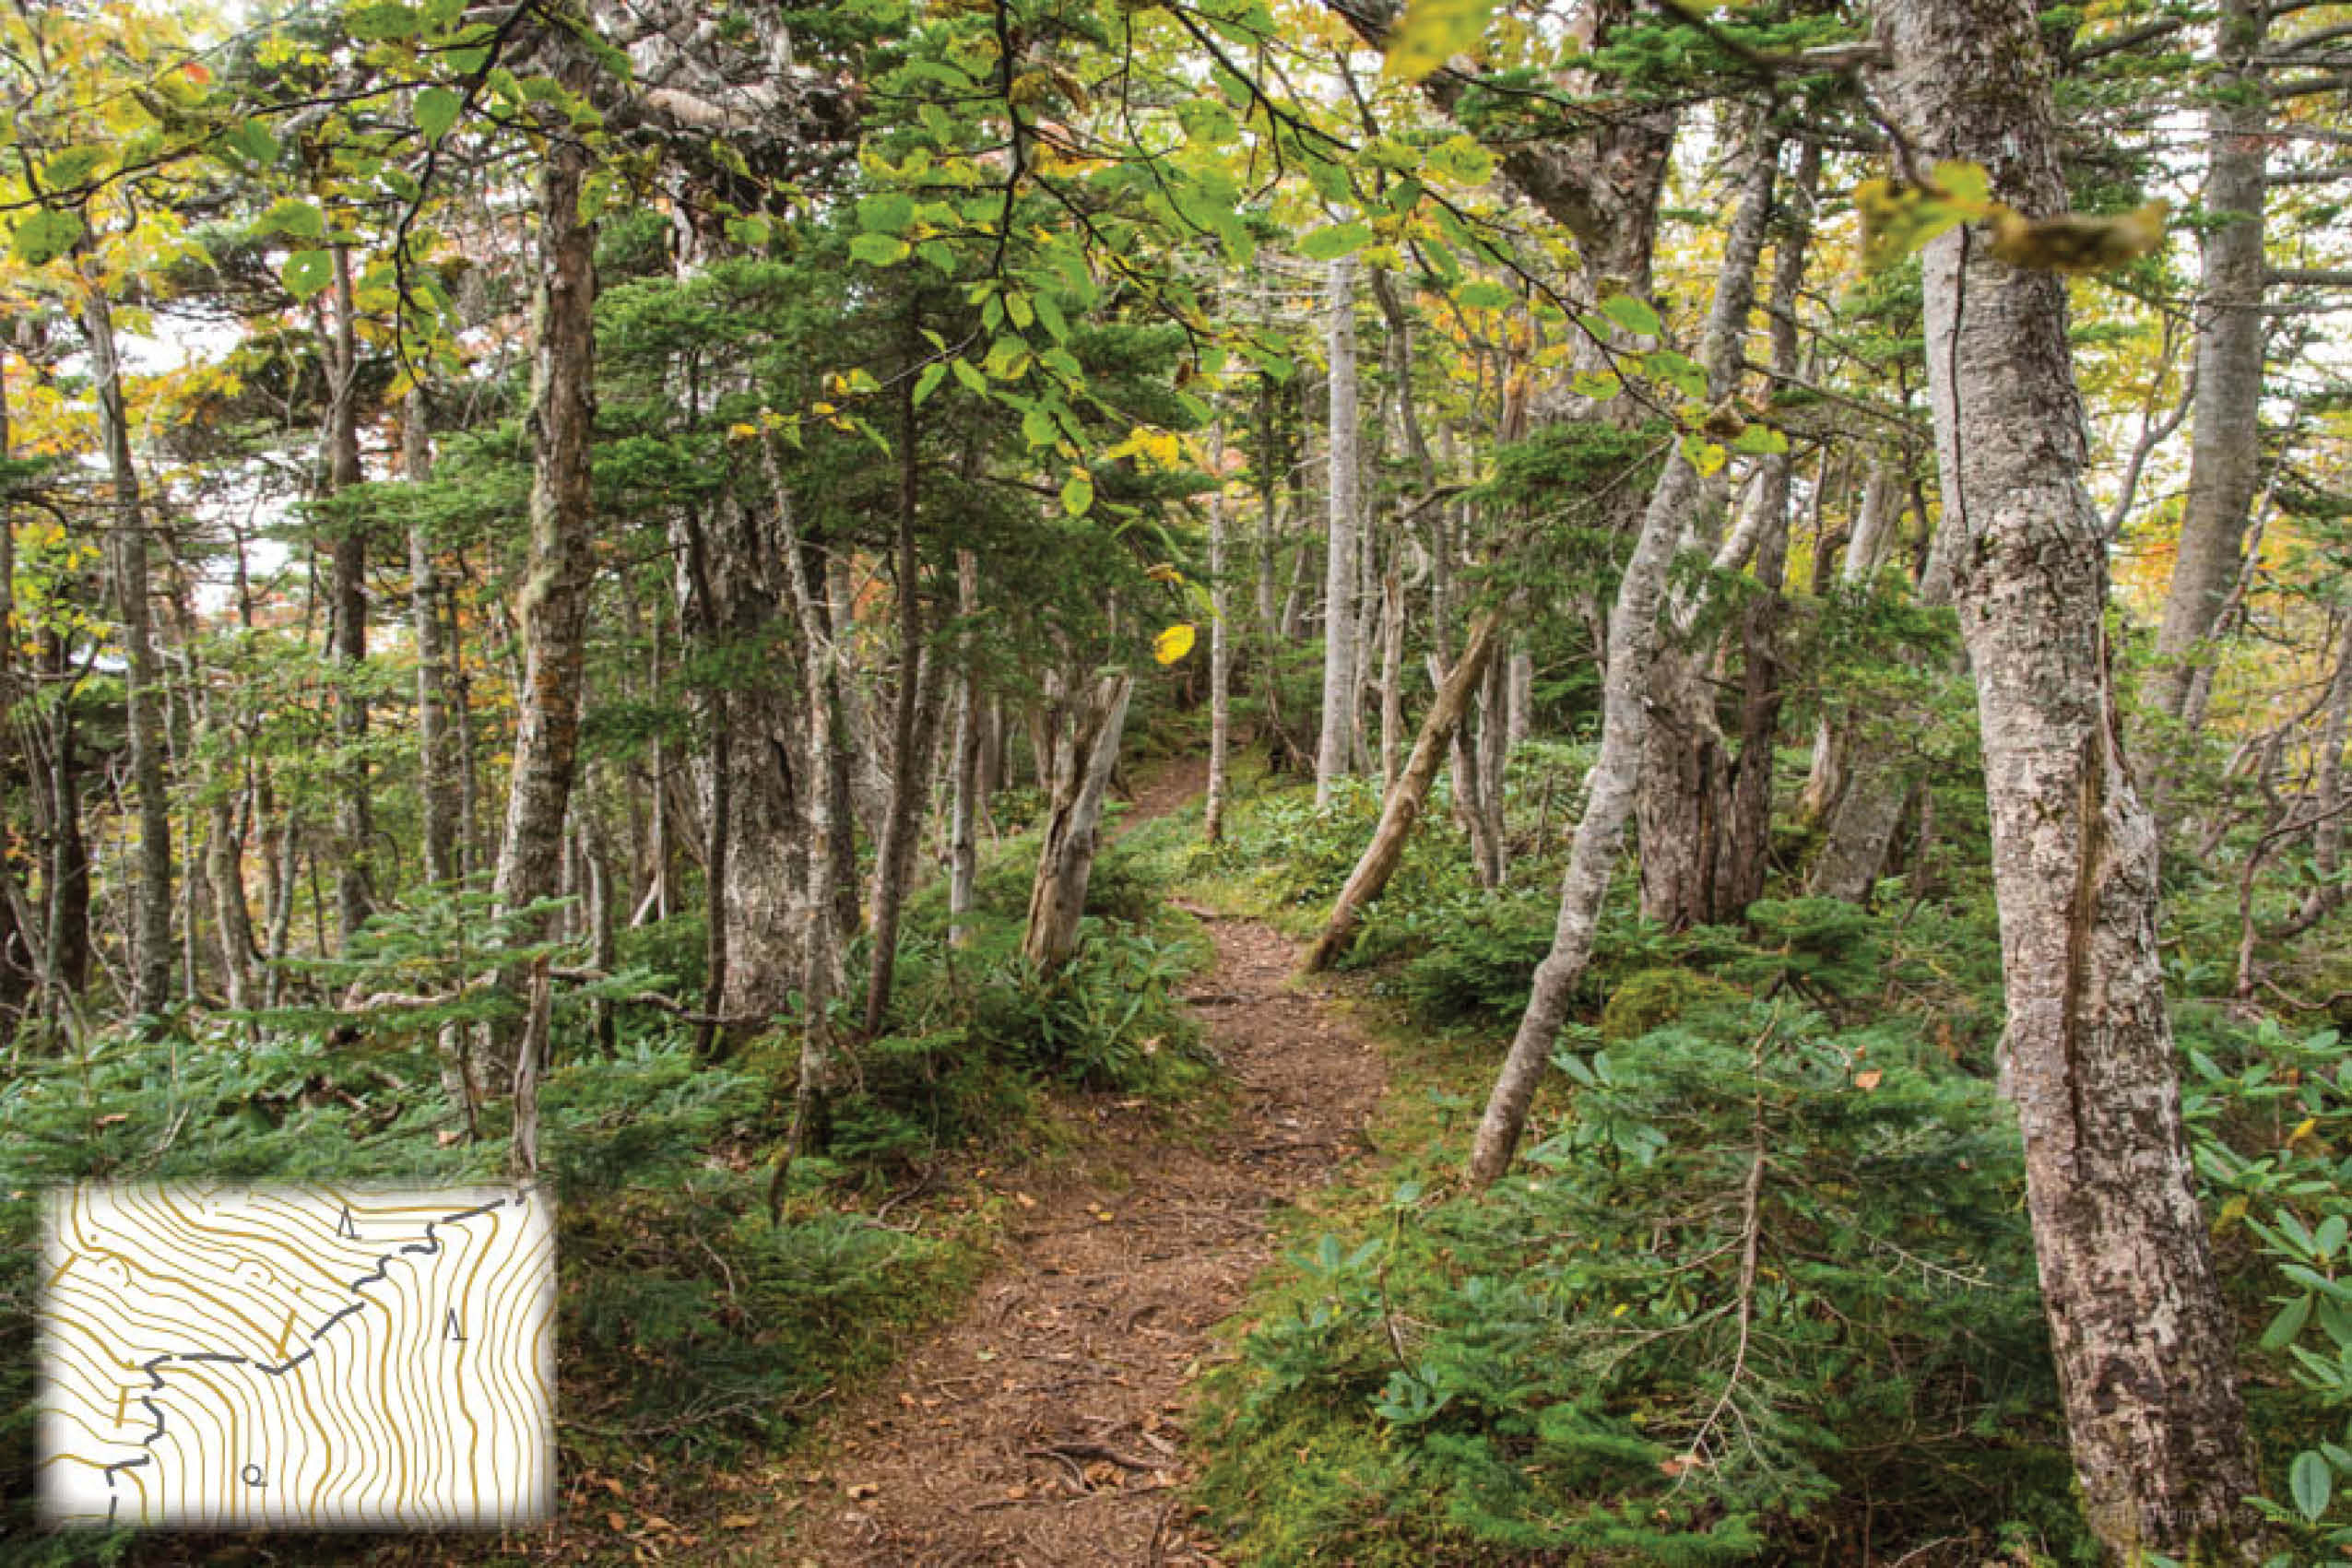
1. Broad-leaved Forest 広葉樹林 kōyōji-yurin
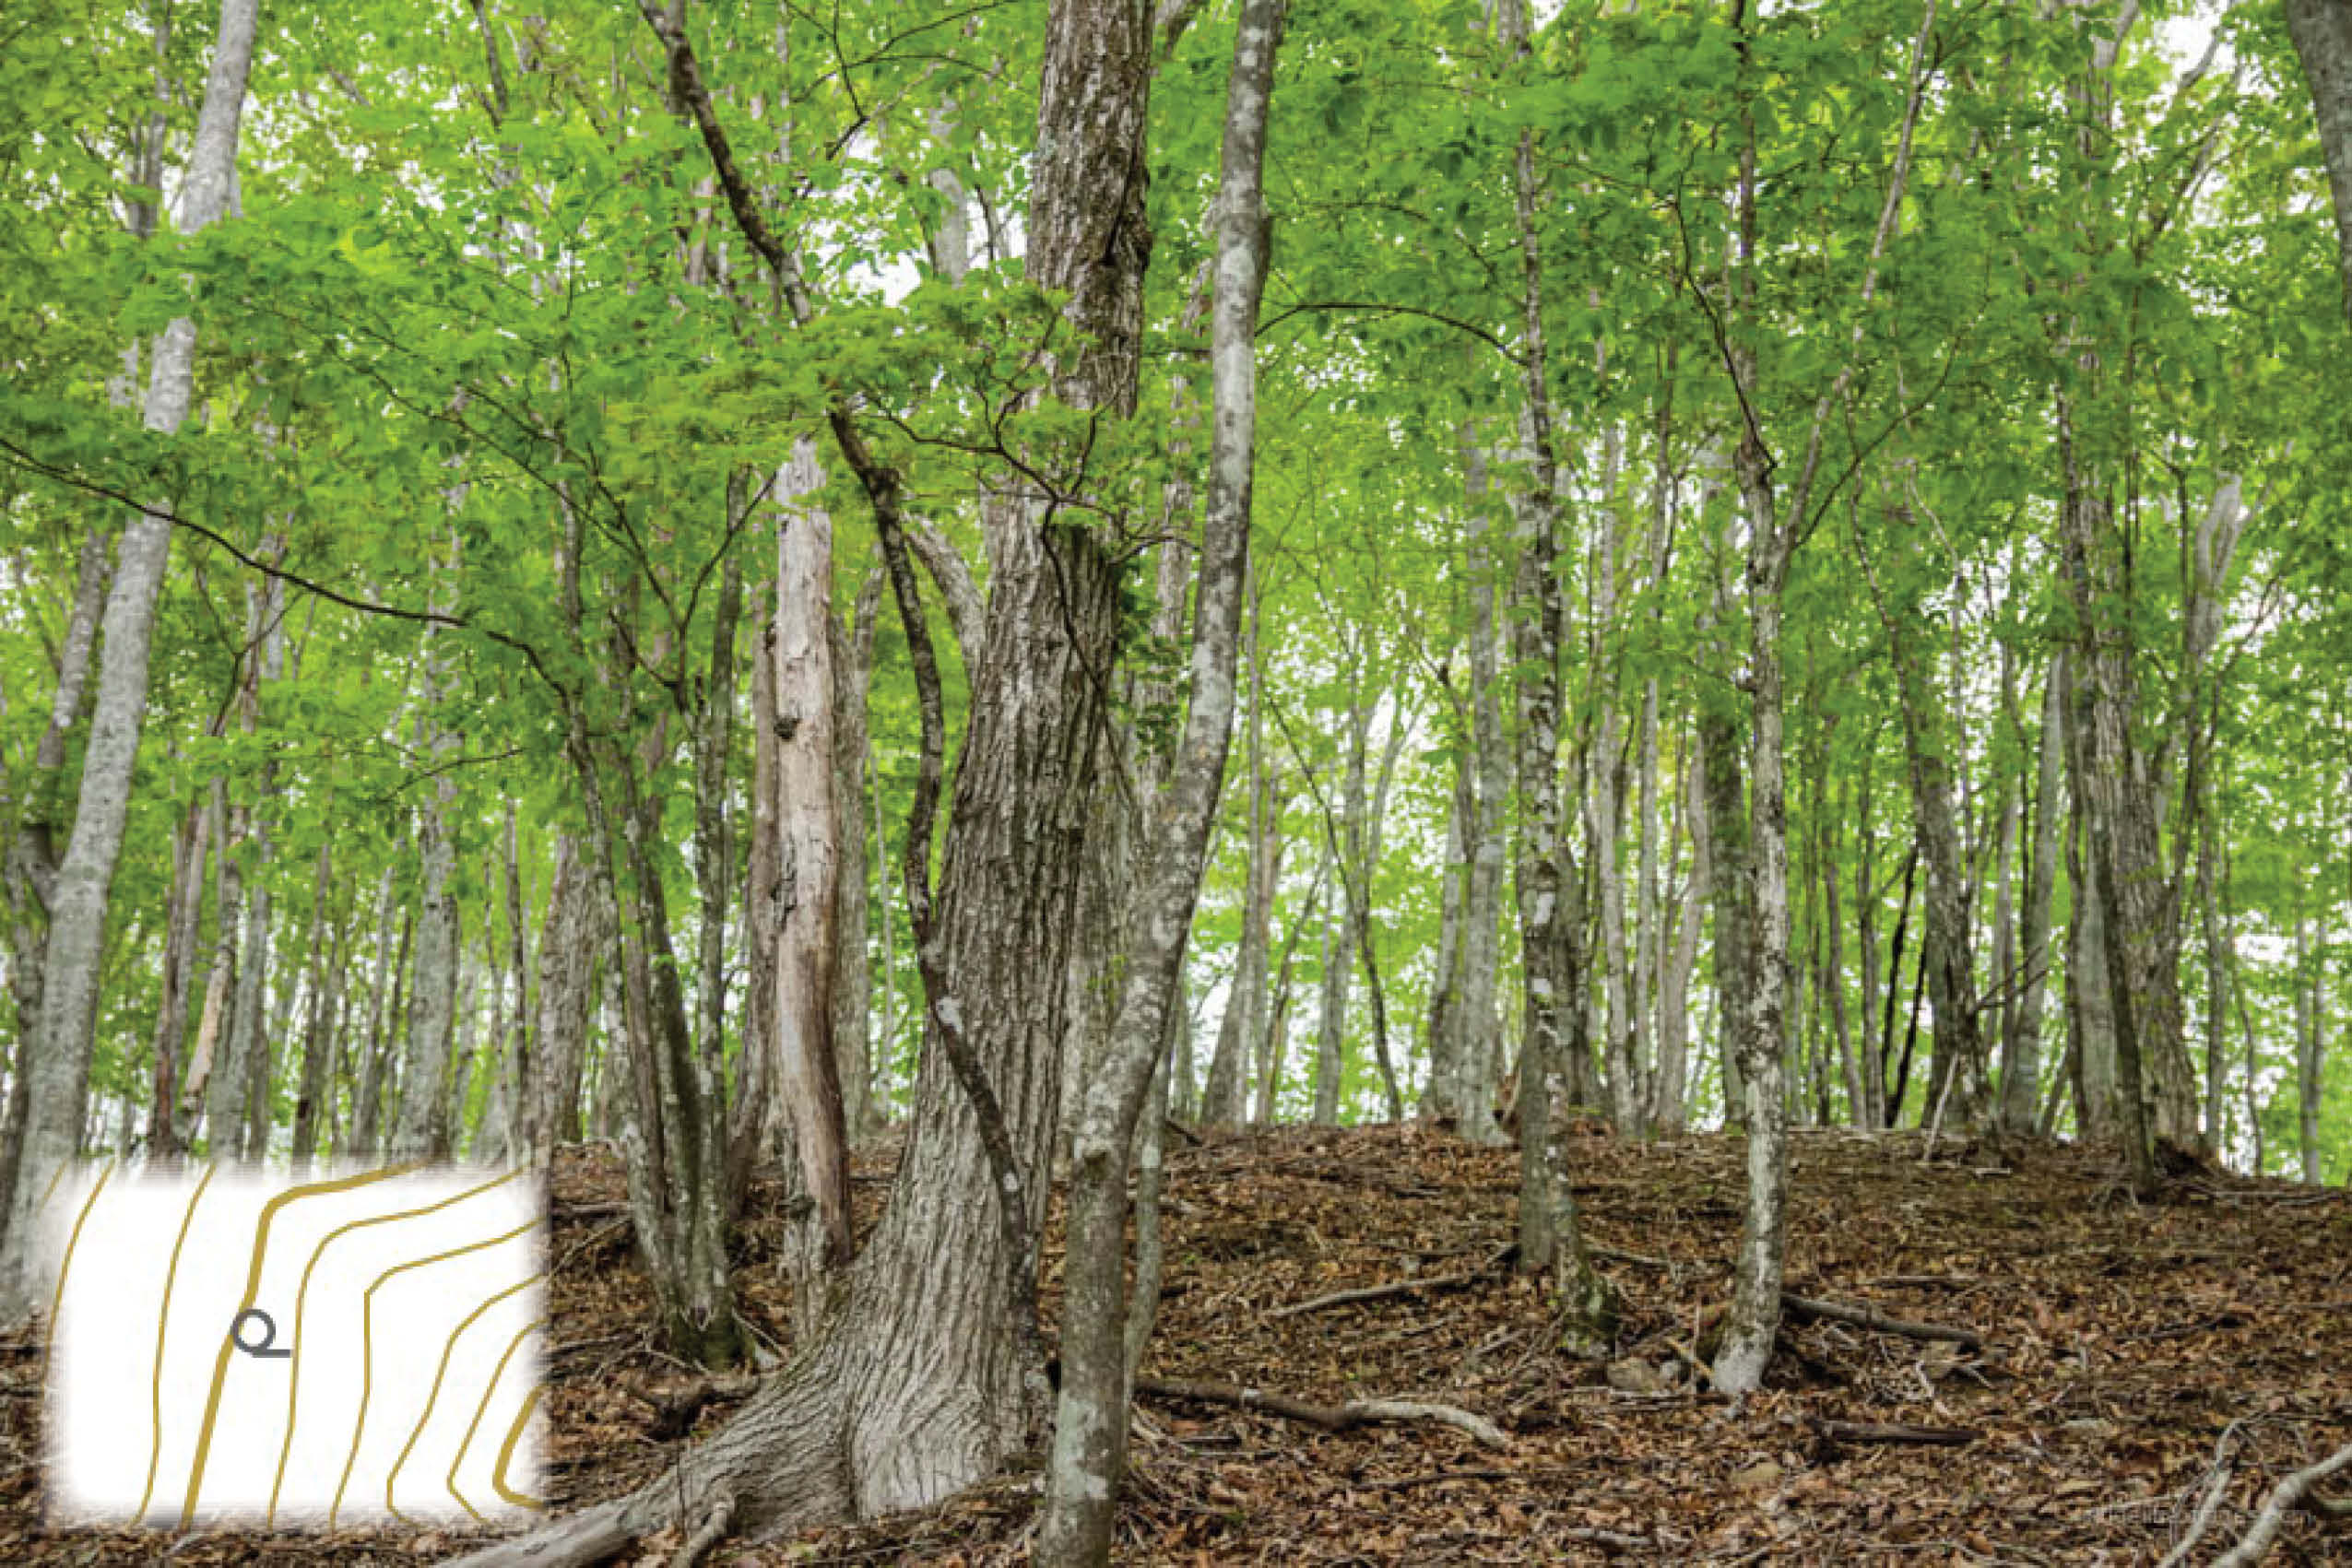
Broad-leaved forests can be classified as evergreen “laurel” forests found in the warm temperate / low alpine mountain zone from Honshu to Kyushu or cold temperate / mountain zone deciduous forest from southern Hokkaido to Kyushu. The broad-leaved forest symbol represents places where hardwood forest grows to a height of at least 2 metres.
2. Coniferous Forest 針葉樹林 shinyōji-yurin
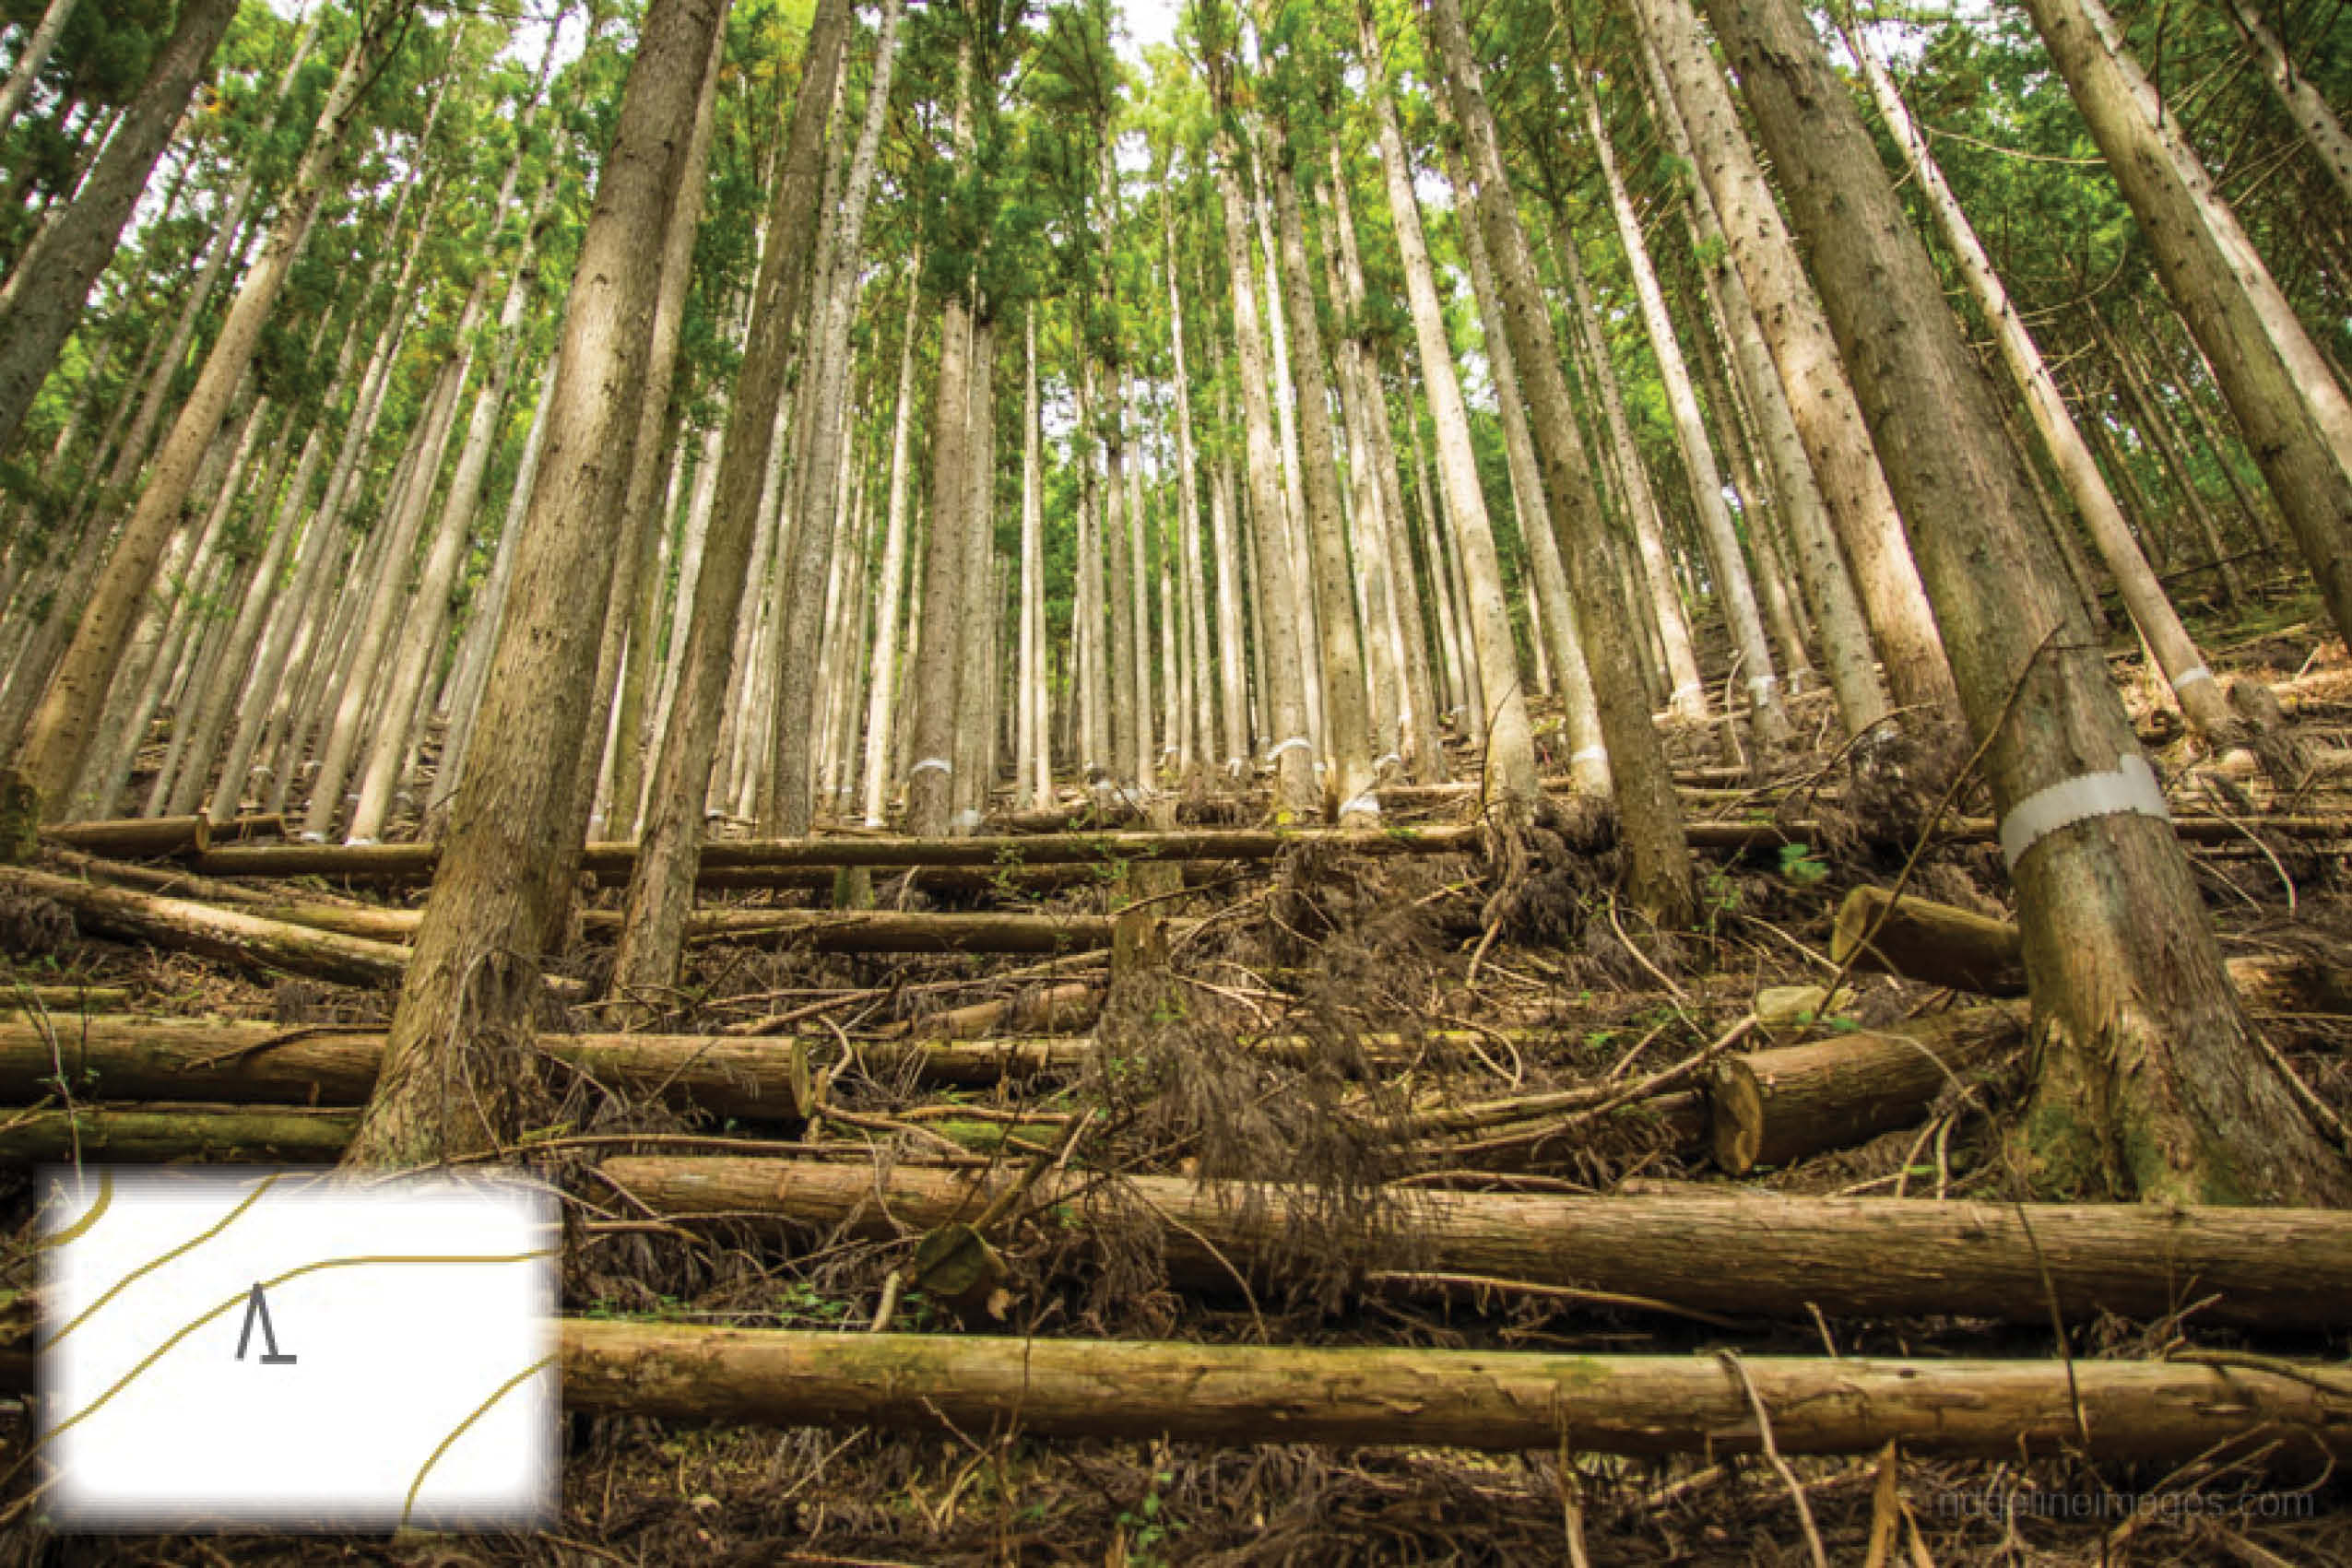
Coniferous trees are mostly found in Japan’s plantation forests established after the Second World War. Cedar, Japanese cypress, and Japanese larch trees occupy nearly 90 percent of the plantation forests. The coniferous forest symbol indicates softwood trees and saplings of at least 2 metres.
3. Bamboo Grass Zone 笹地 sasa-chi
Sasa or bamboo grass is a common feature on or near the ridgeline. The bamboo grass zone denotes sasa less than 2 metres, meaning in most cases you’ll have an unobstructed view. Note that the map symbol is similar to bamboo forest.
4. Bamboo Forest 竹林 chiku-rin
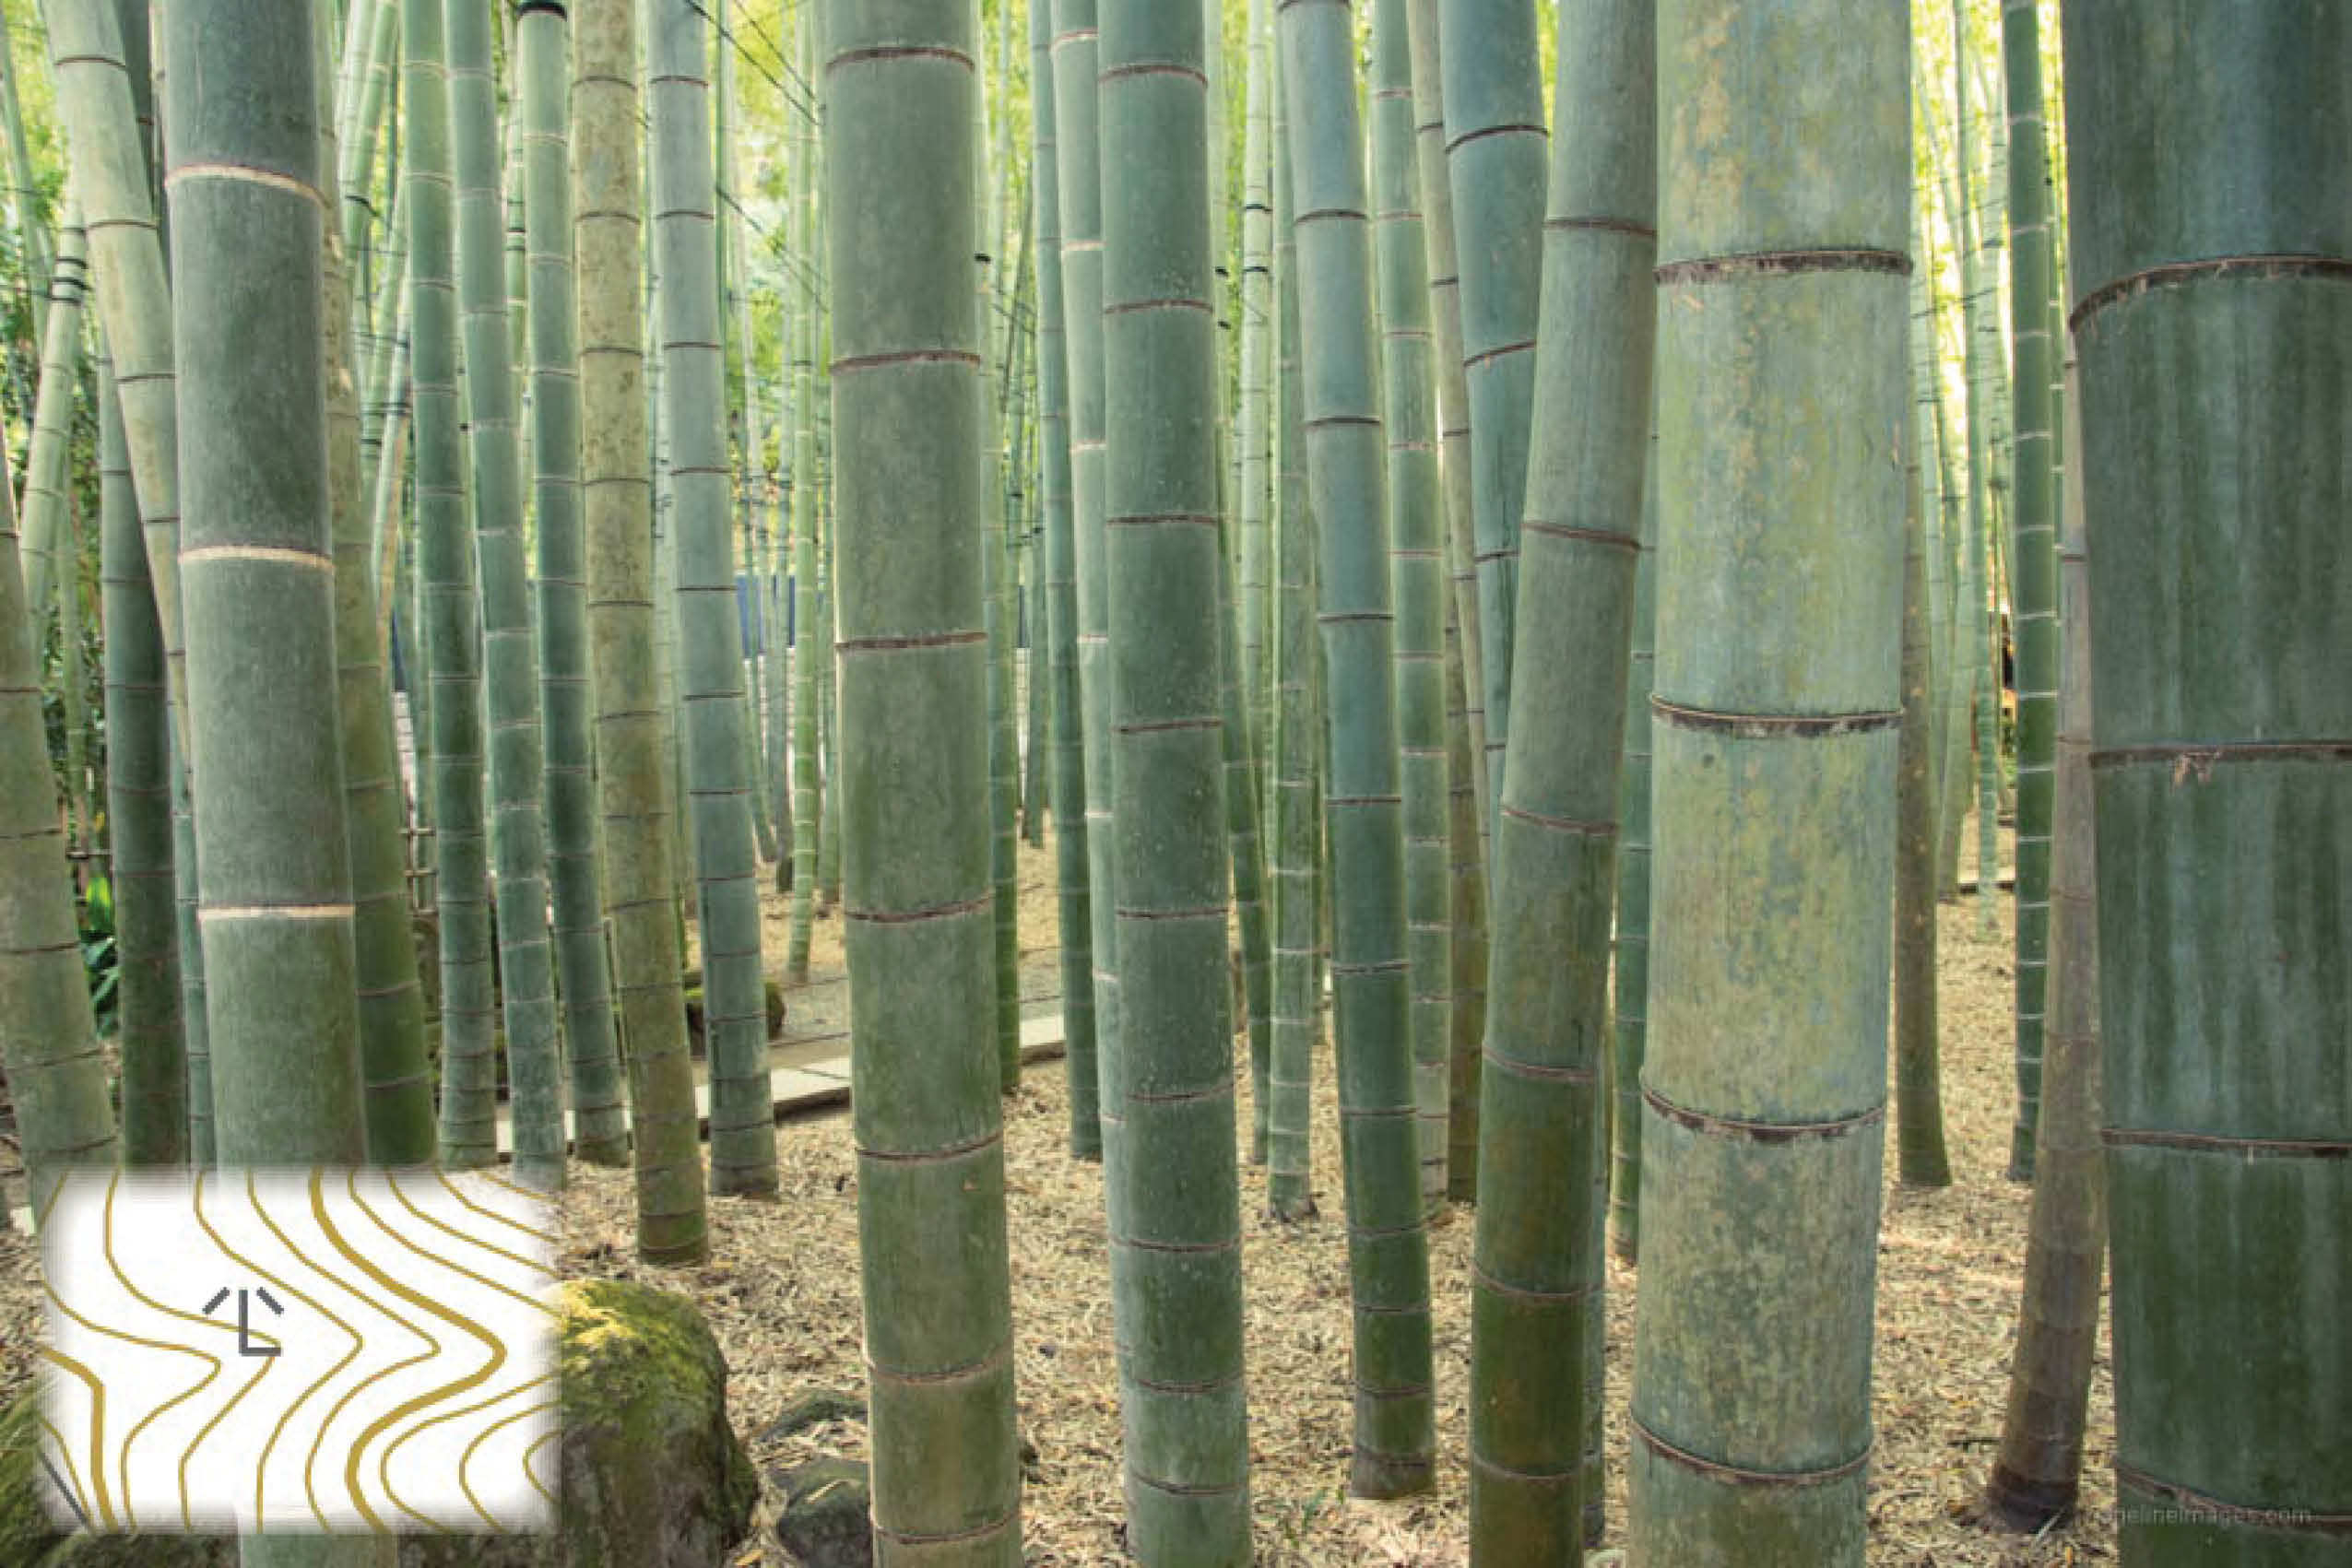
Groves of bamboo or take can be found in a range of environments including lowland mountains and along river verges.
5. Creeping Pine Zone ハイマツ帯 haimatsu-tai
Pinus pumila or creeping pine, is native to north-eastern Asia. In Japan, it is distributed from Hokkaido to the Chubu region, with its southern limit at Mt. Tekari in the Minami Alps. On high alpine ridgelines, it ‘creeps’ along the ground, though grows taller in subalpine forest. The zone it occupies is exposed to the elements, so be mindful of the weather when hiking through it.
Landform Features
6. Earth Cliff 土崖 dogai
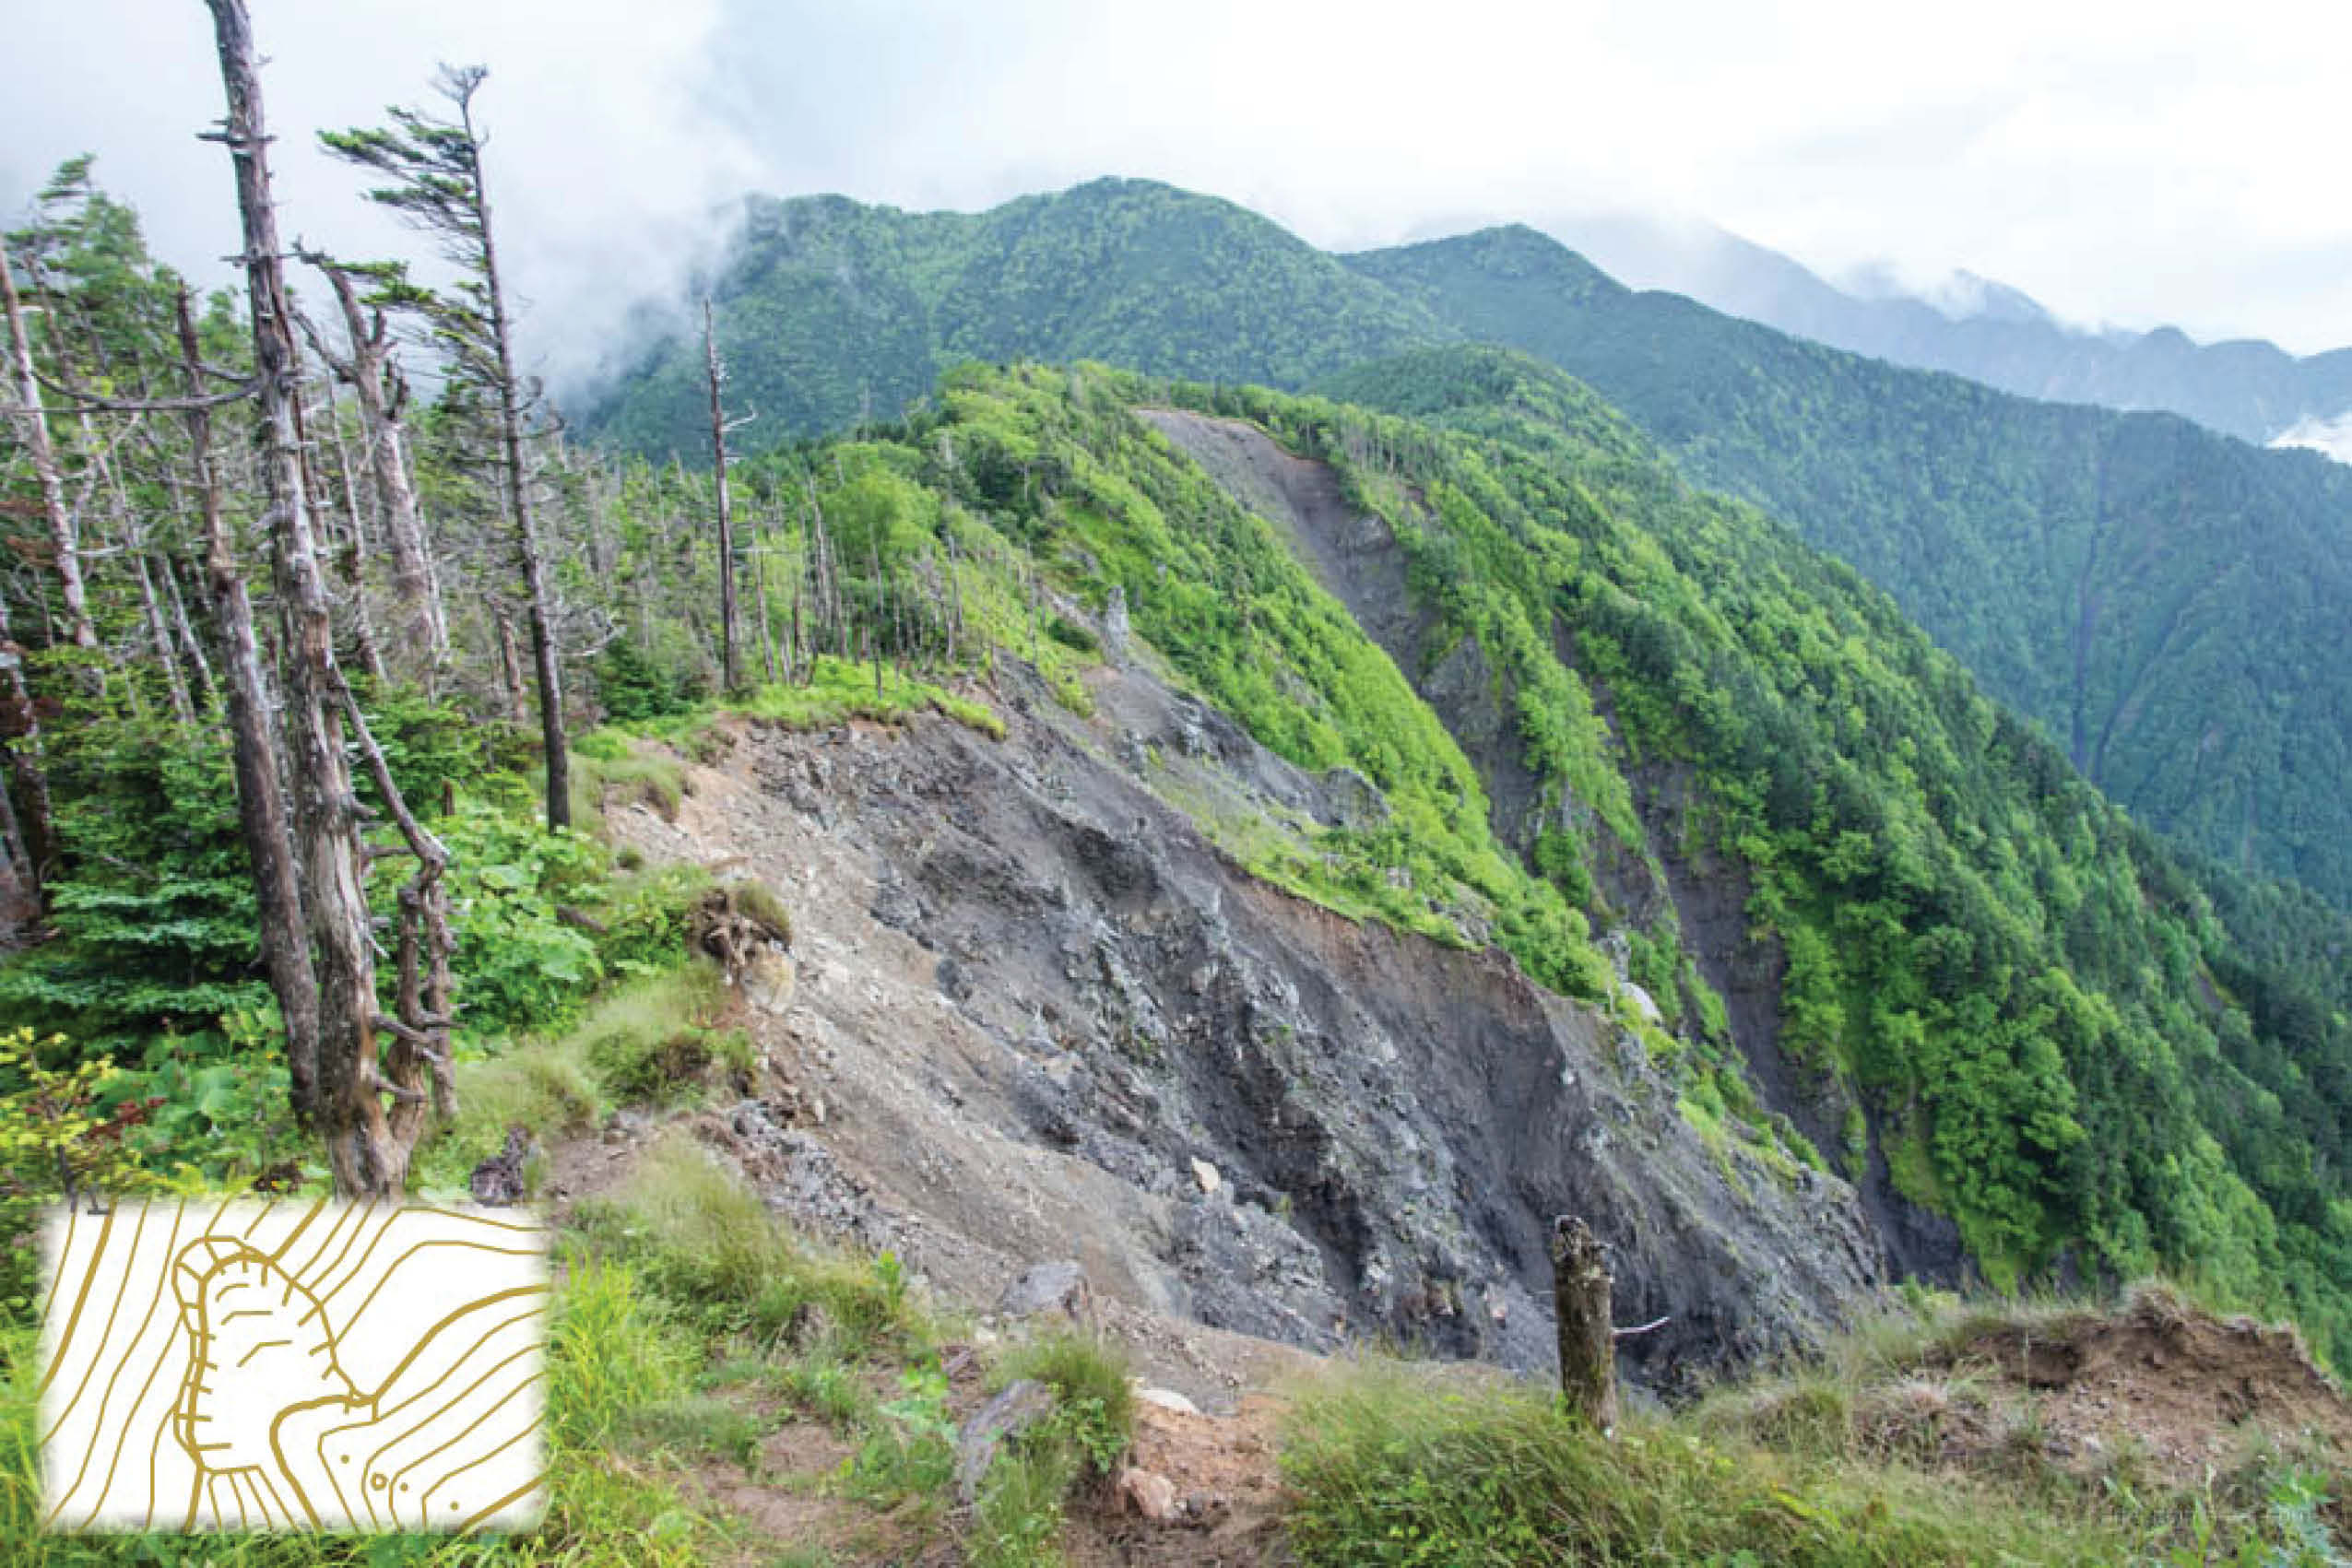
An earth cliff is represented by steep slope with a height of at least 3 metres and a length of more than 75 metres. They are formed when the surrounding ground collapses. Comprehending the full extent of the cliff and distinguishing it from its surroundings means it not always helpful for marking your position.
7. Crater 噴火口 funkakō
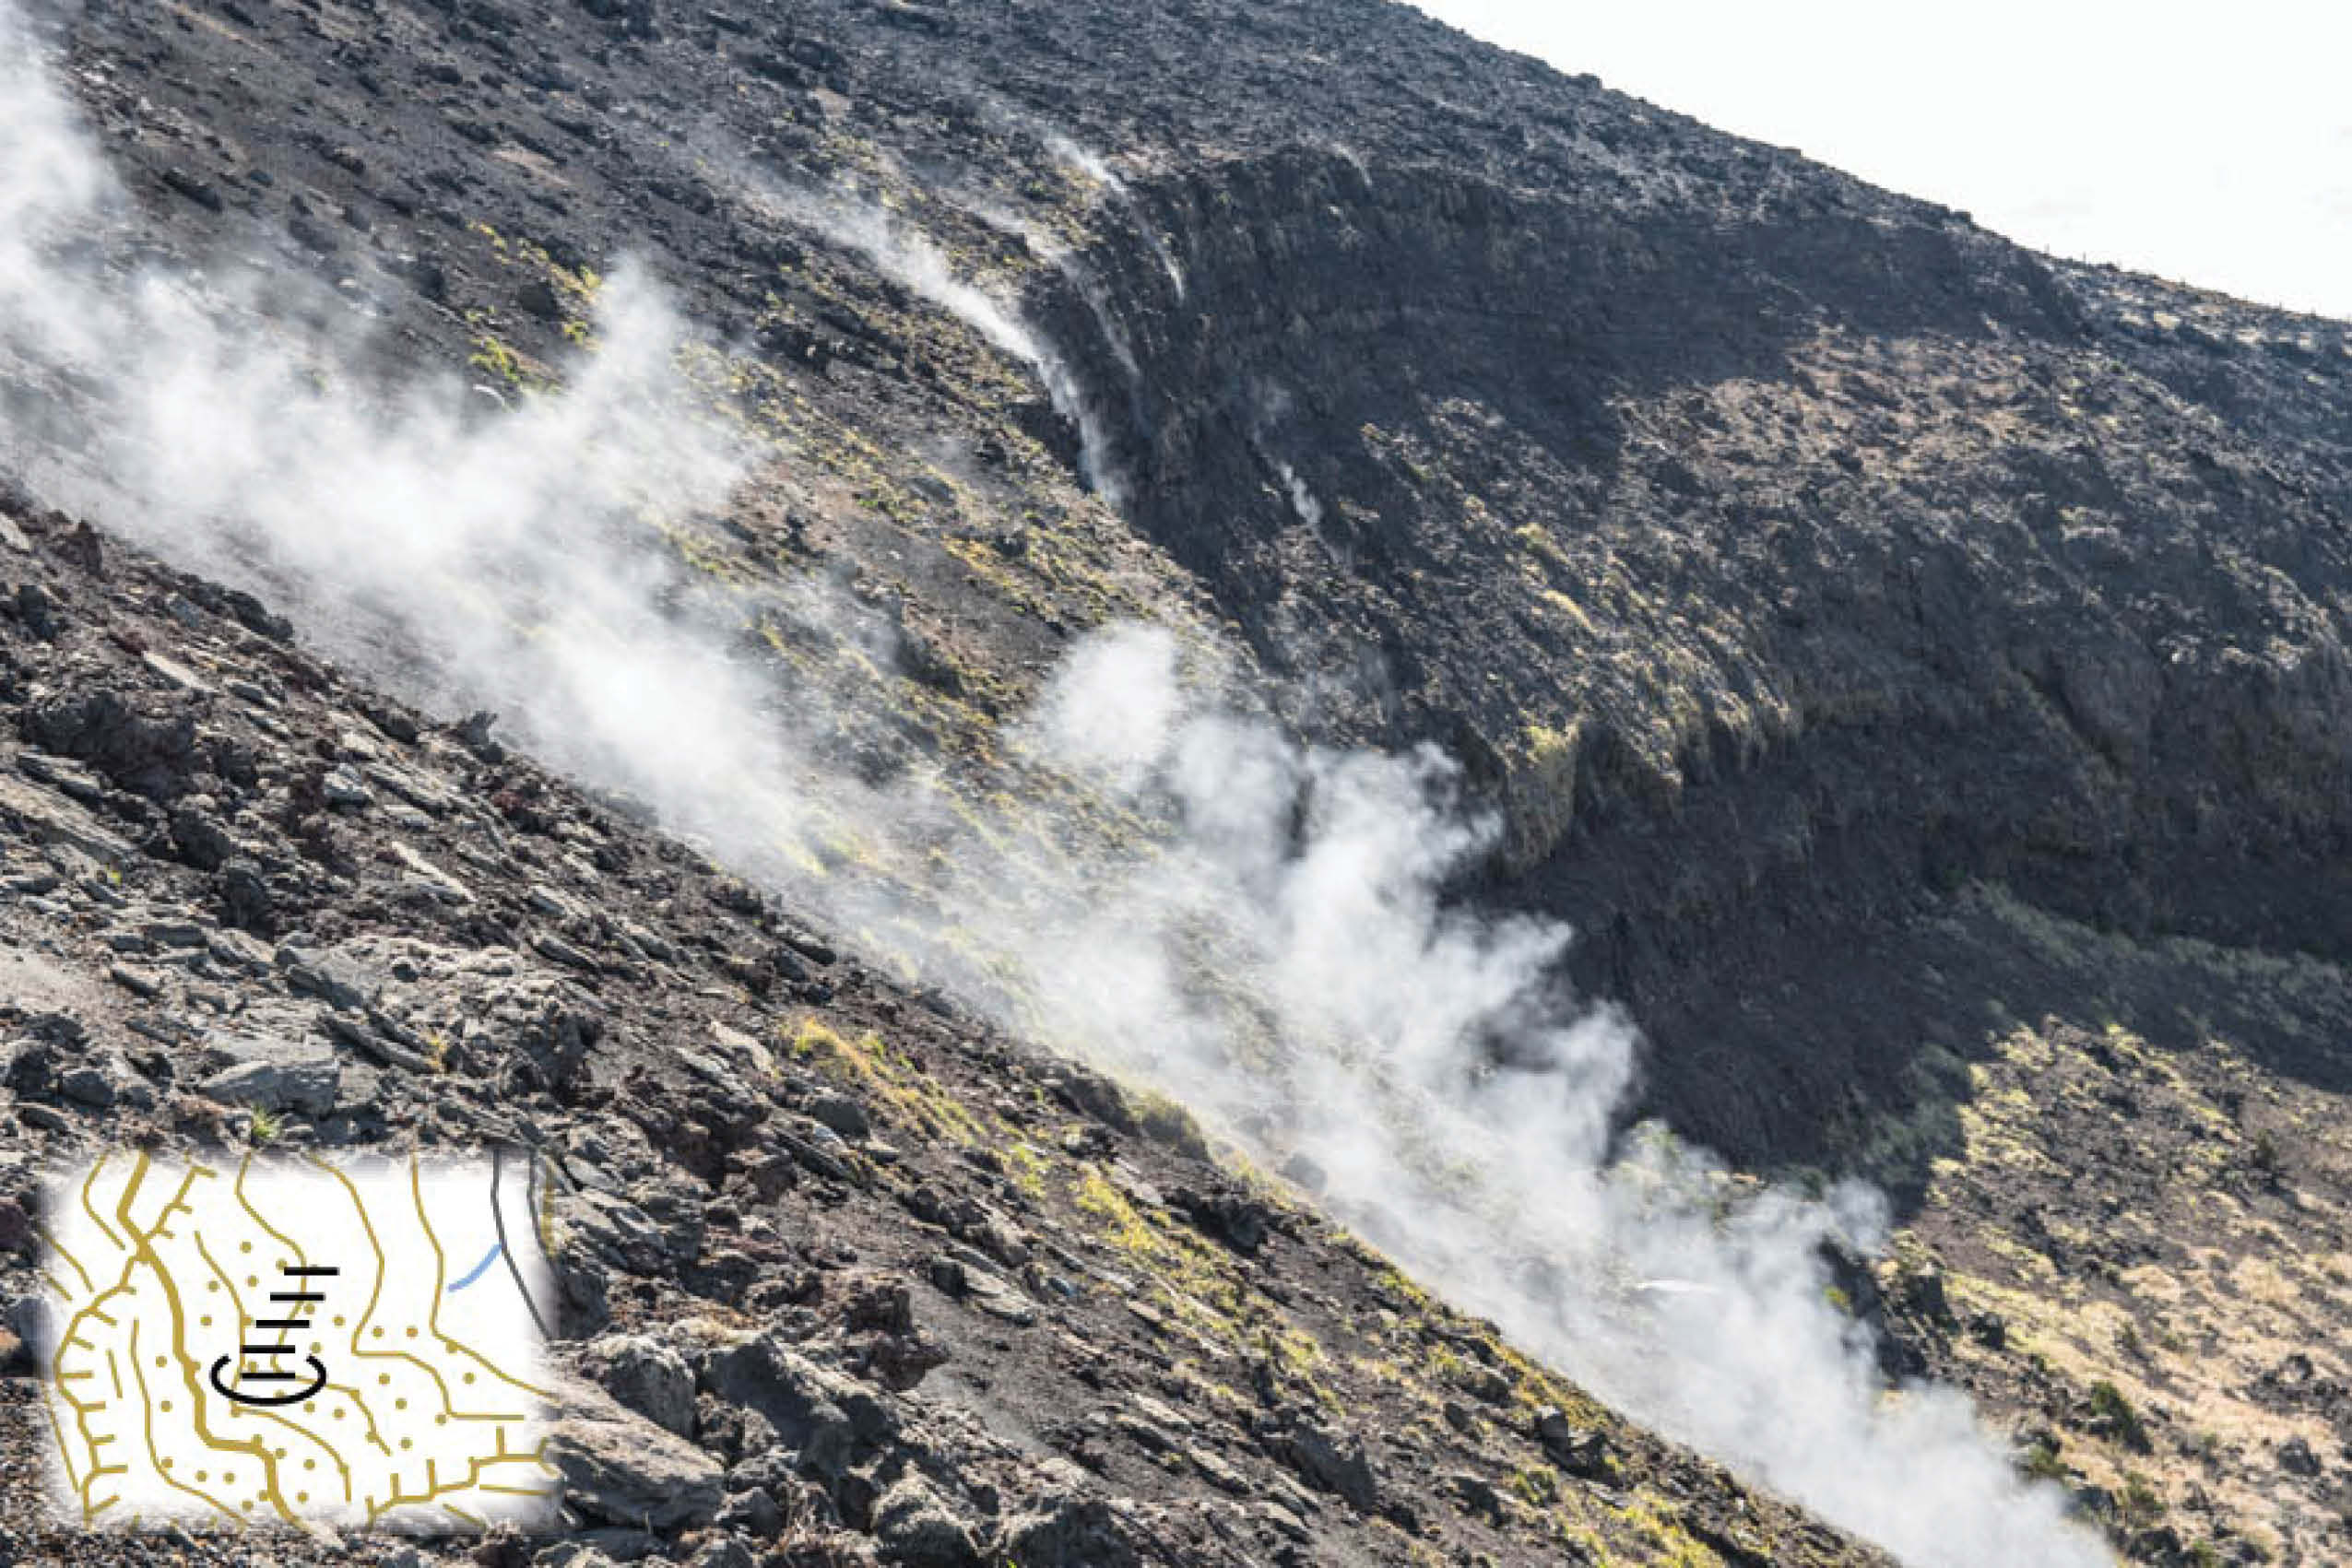
This symbol is used to indicate craters with active fumaroles or, in the case of volcanoes, where eruptions may occur but are currently dormant. Volcanic gases can arise from the hillside as well as top of the crater.
8. Crag 岩崖 iwa-gake
In a similar vein to the earth cliff, for a rocky precipice to be marked on the map, it needs to be at least 3 metres in height and 75 metres in length. As it usually presents with prominent rocks and gravel in the surrounding terrain thus it cannot be reliably used to mark your position.
9. Rock 岩 iwa
This mark is used to designate a rocky area rather than individual rocks. If the rock-strewn area extends over a wide zone, you will struggle to determine your specific location.
10. Rough Forging 荒地 are-chi
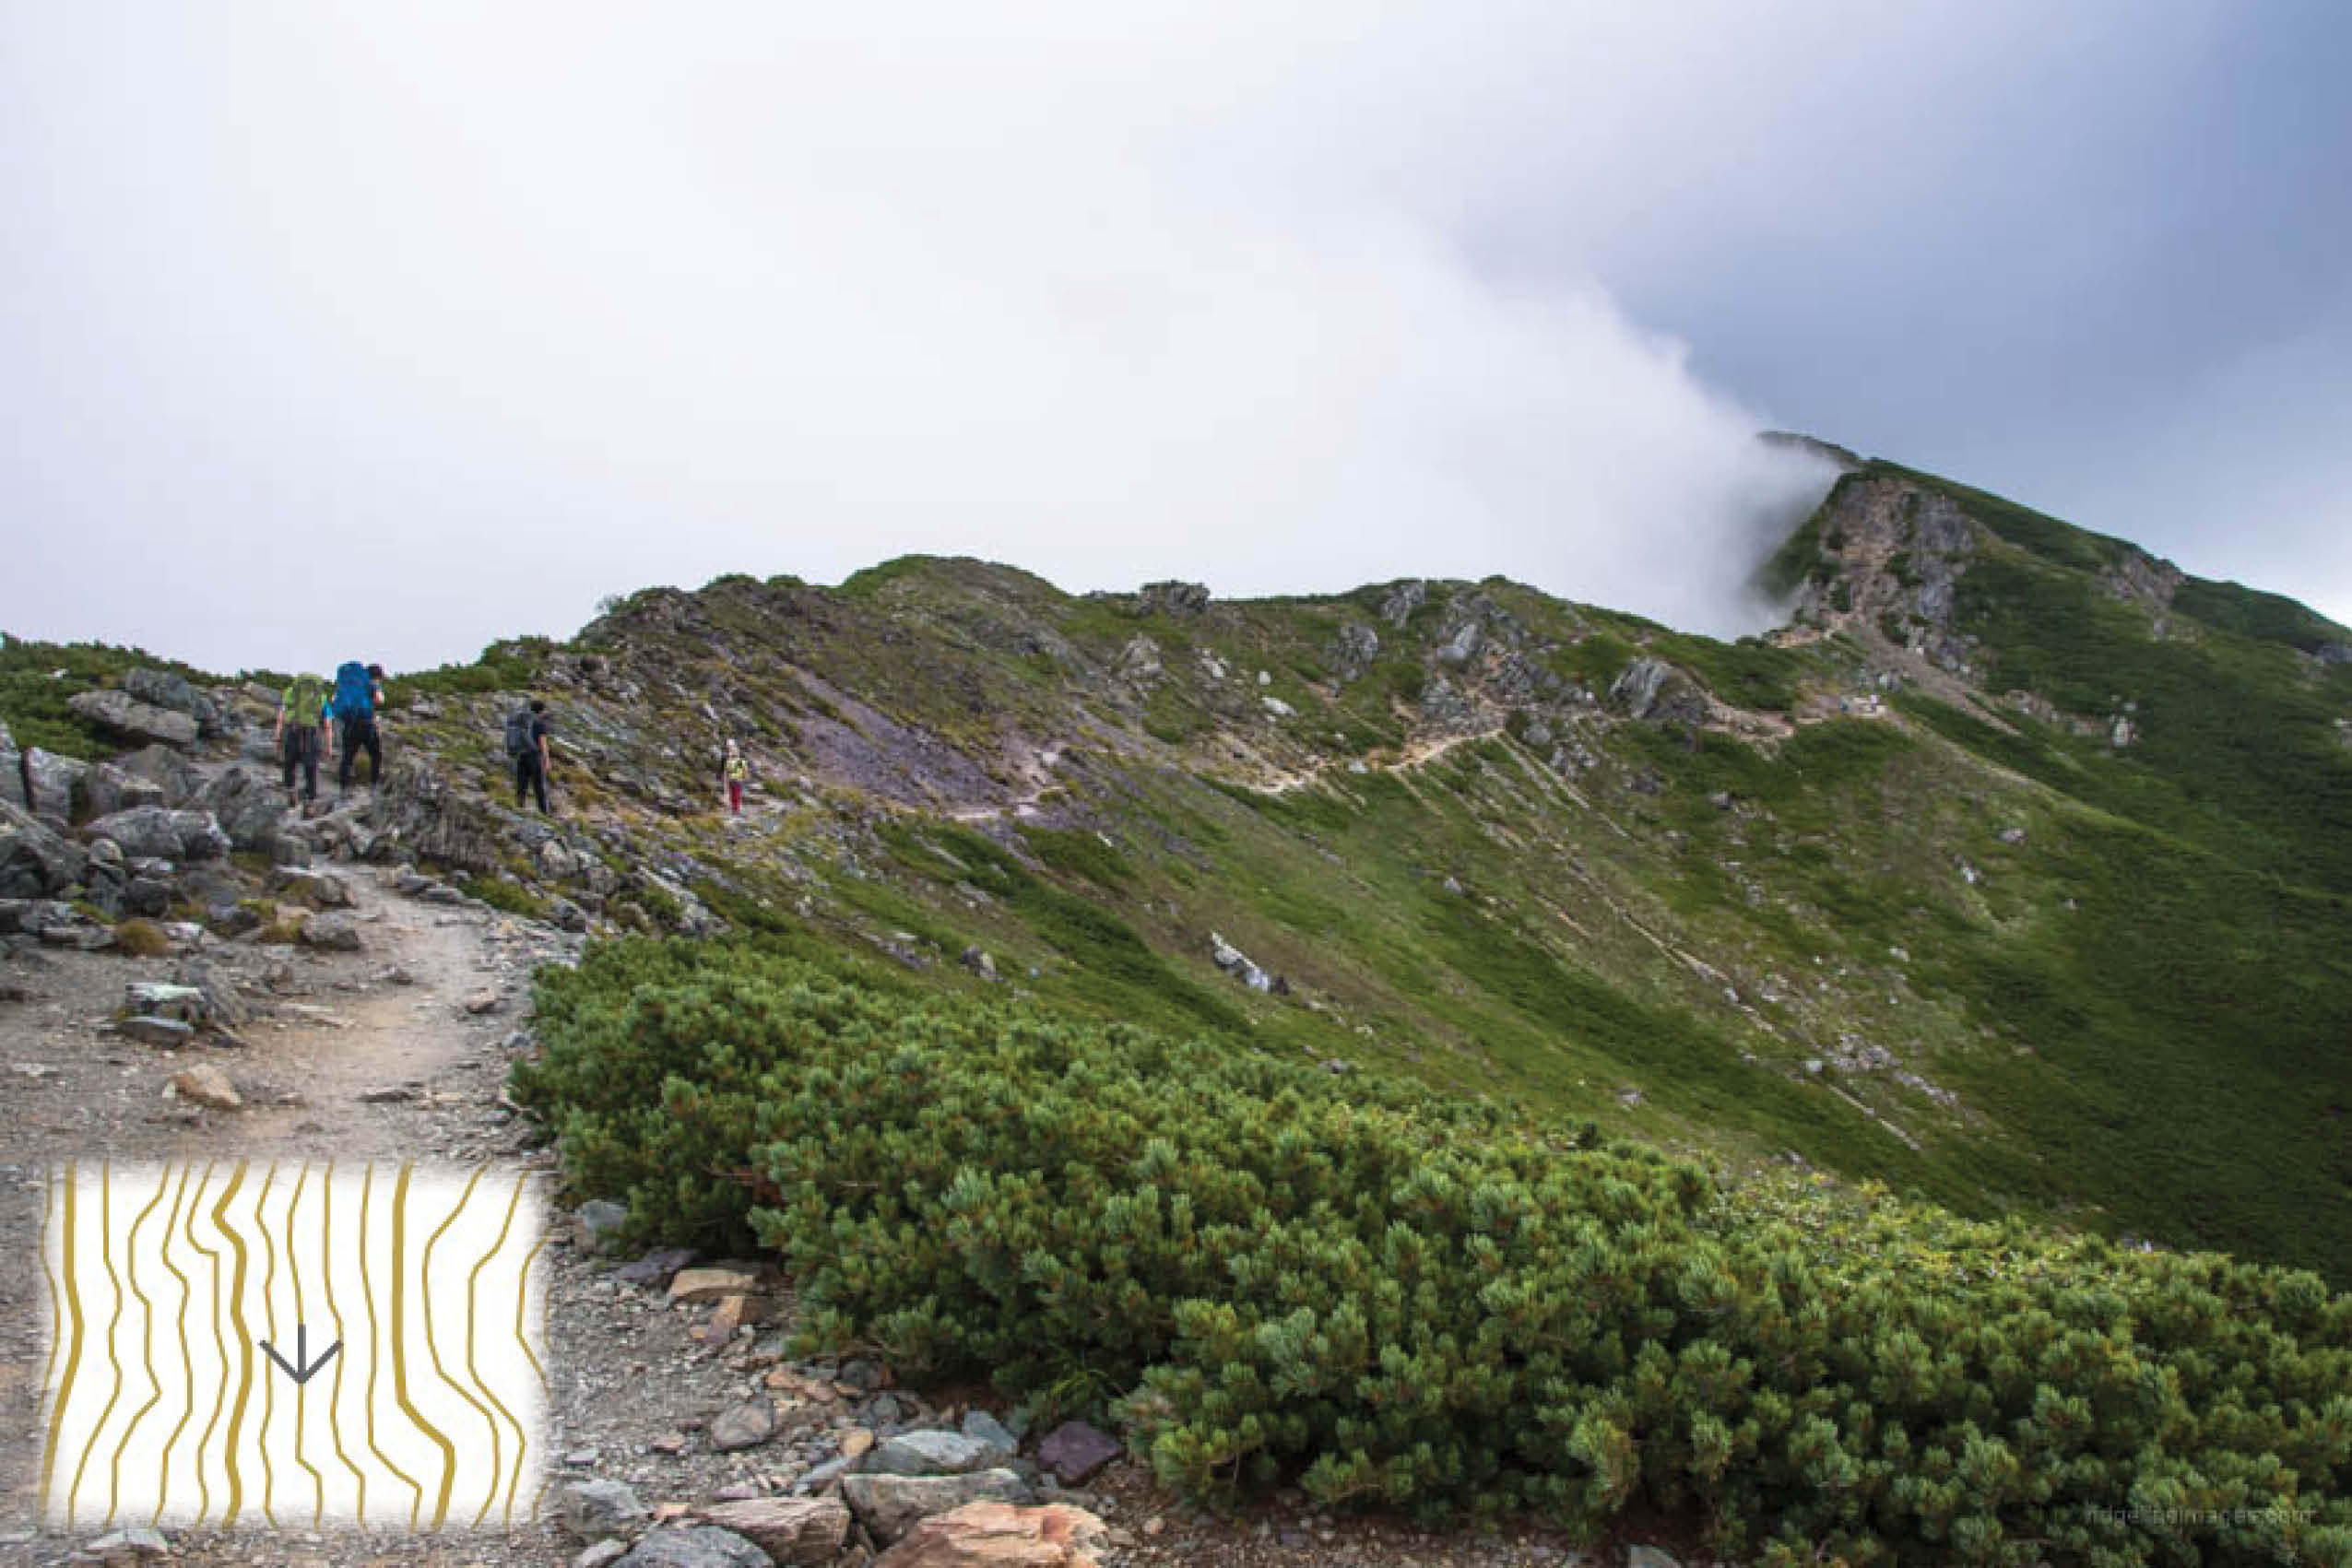
In mountain areas, the rough forging symbol denotes grassland and shrubland characterised by an unencumbered view.
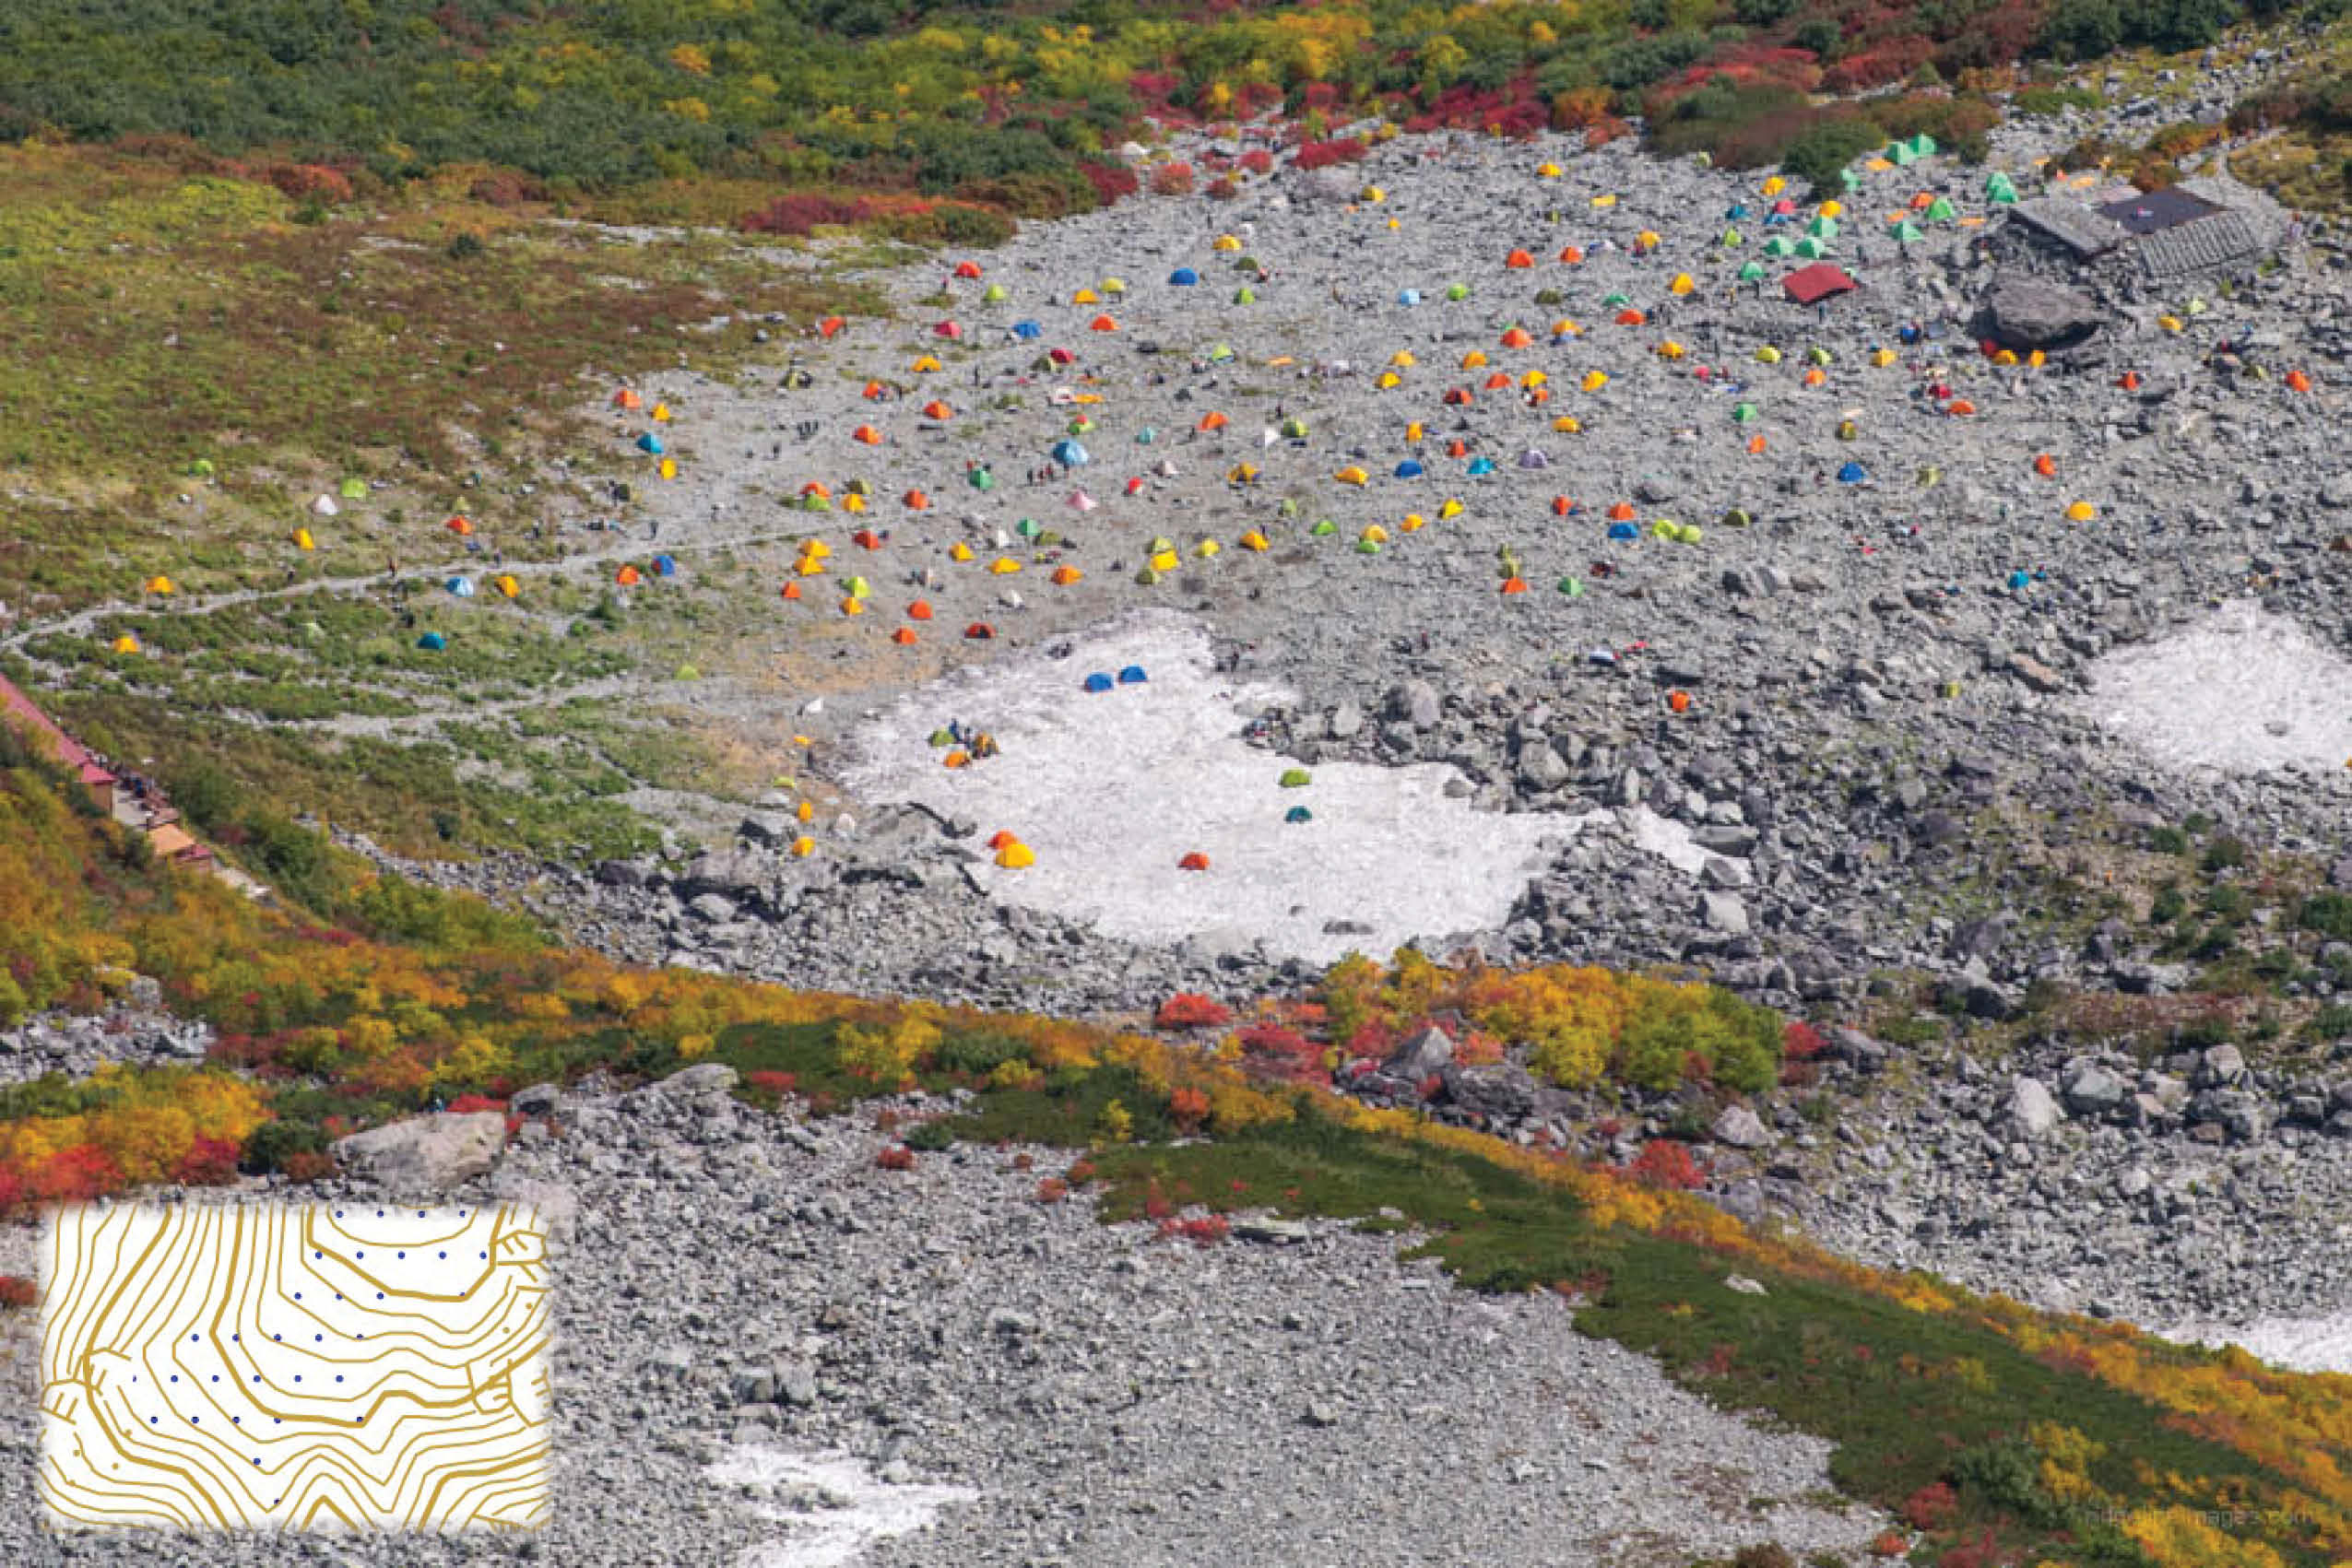
11. Gravely Sand 砂礫地 sare-kichi
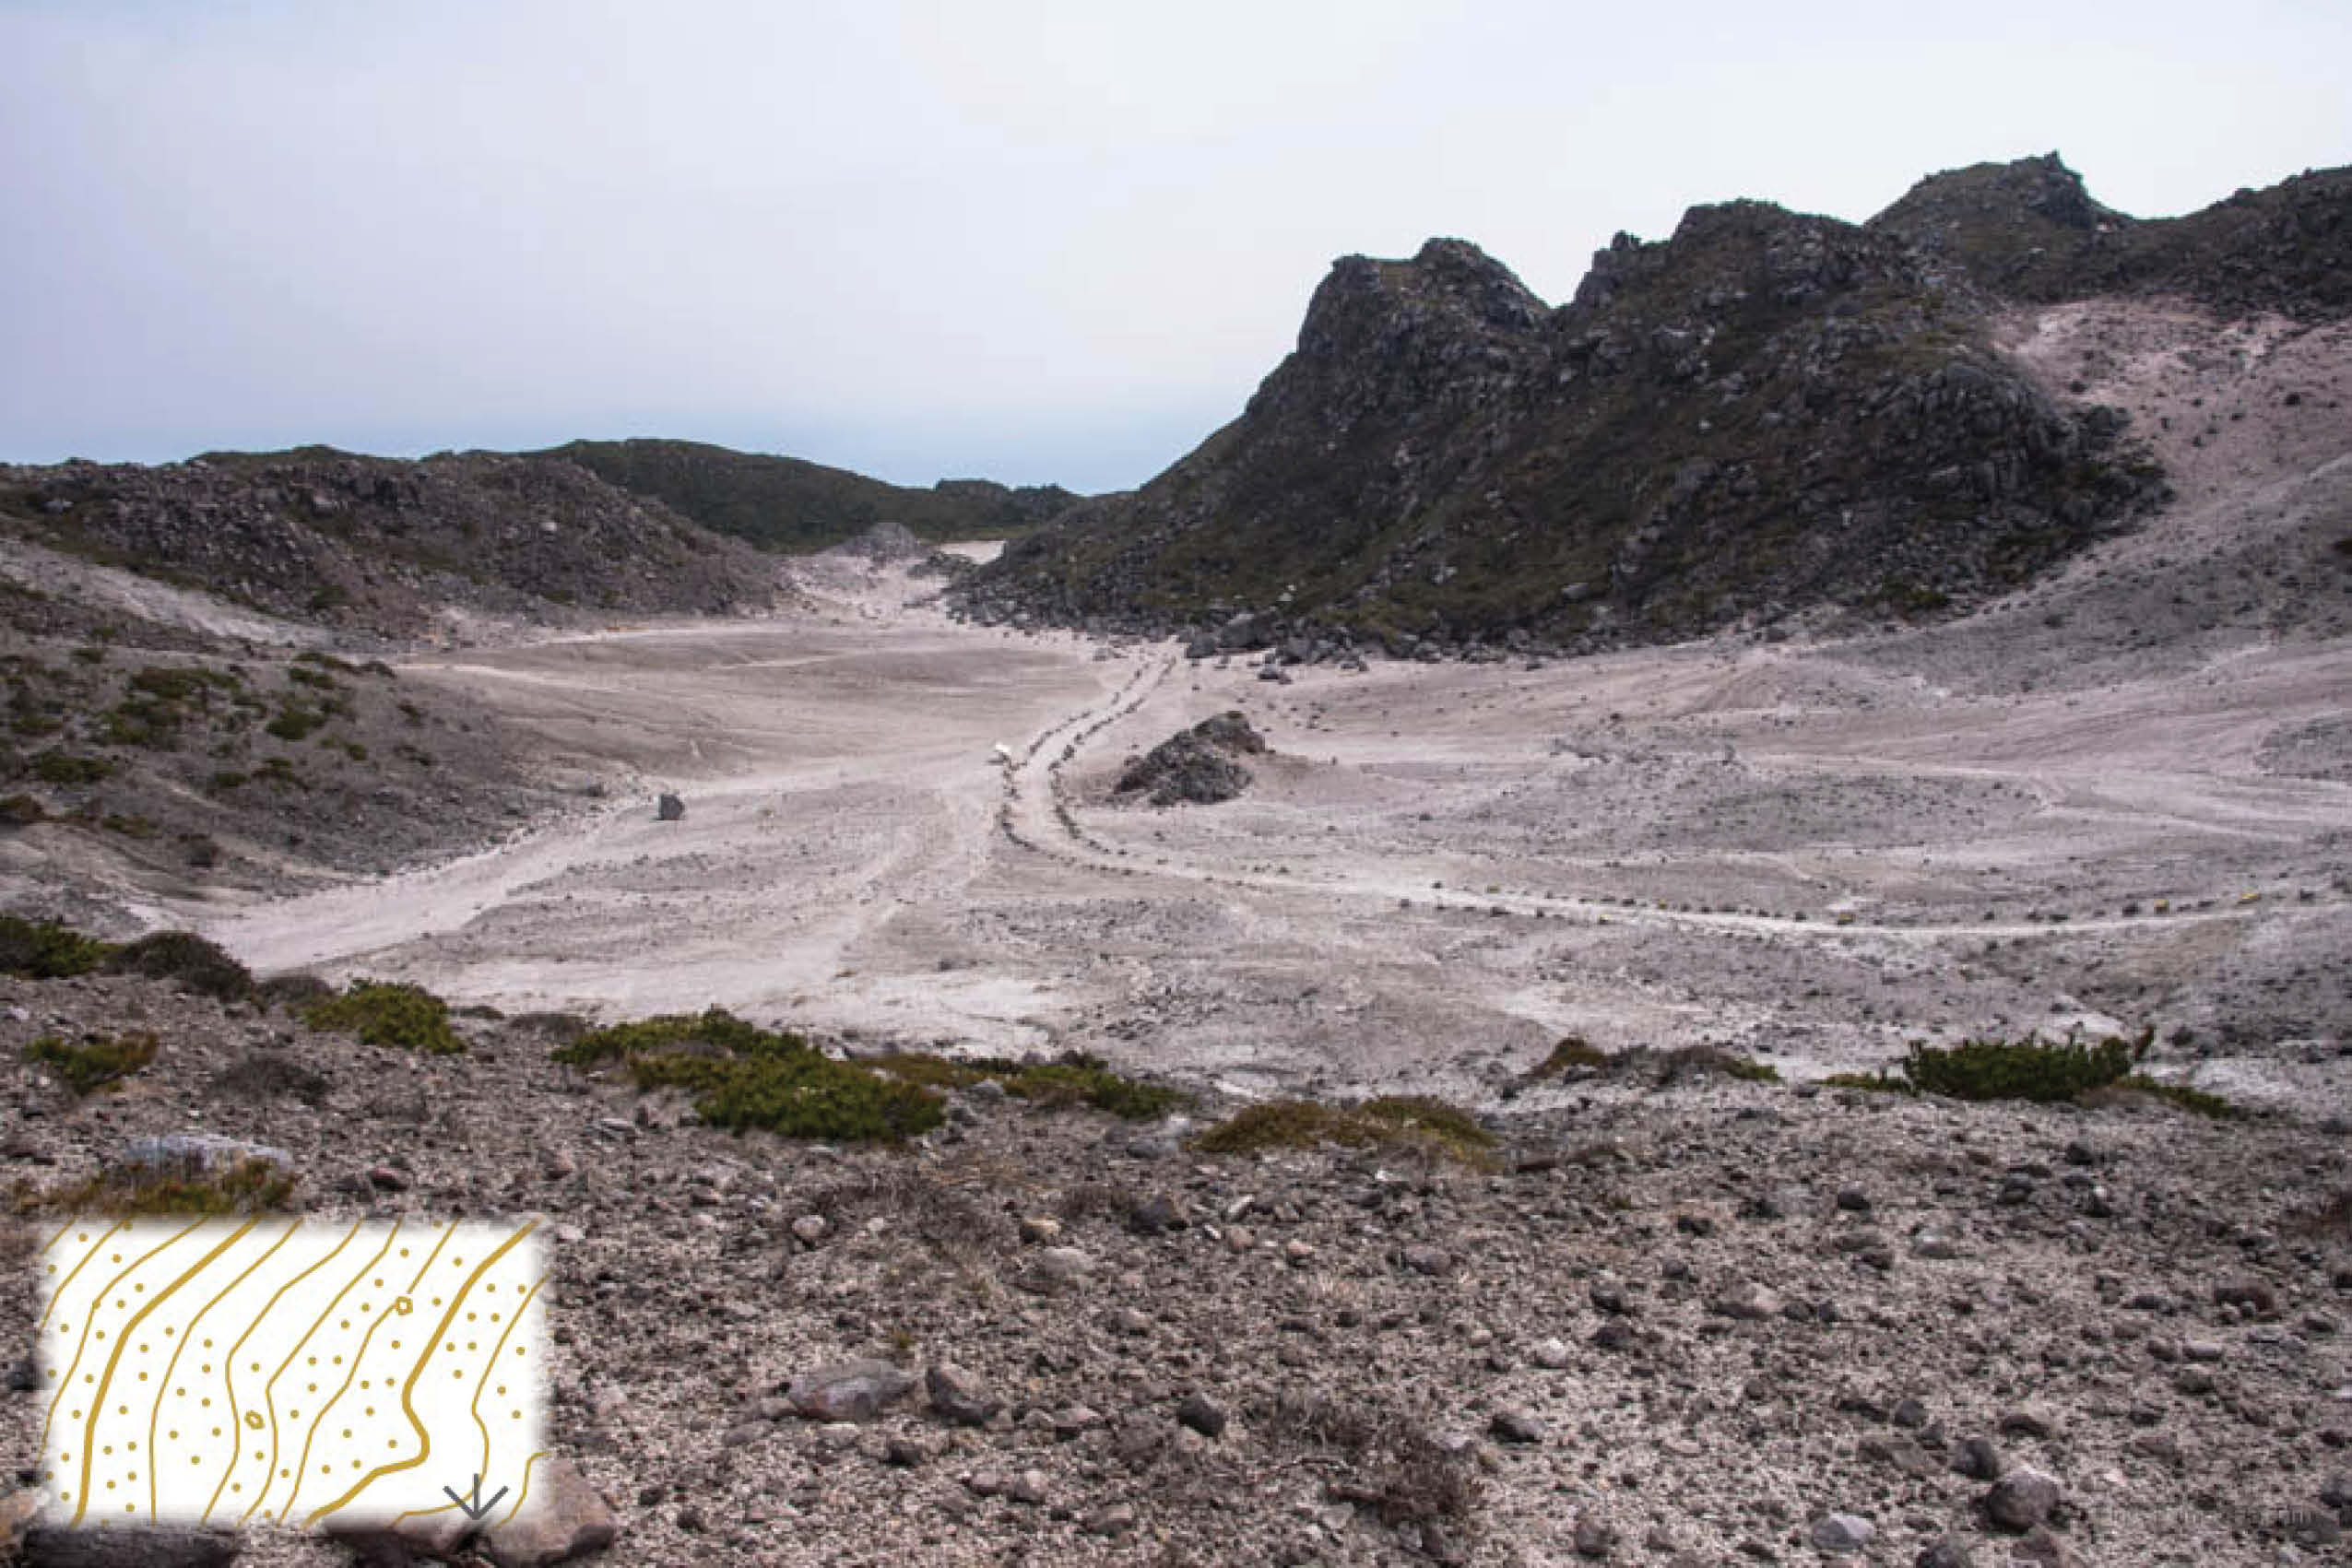
Gravely sand represents areas, as you probably guessed, layered in sand and gravel. It can be observed in a wide variety of places, including sandy beaches, riverbanks covered with small stones, and islands such as Mt. Tenjo on Kozushima. In the Japanese Alps, this kind of terrain is often seen through the alpine zone.
Water Bodies
12. Pond 池 ike
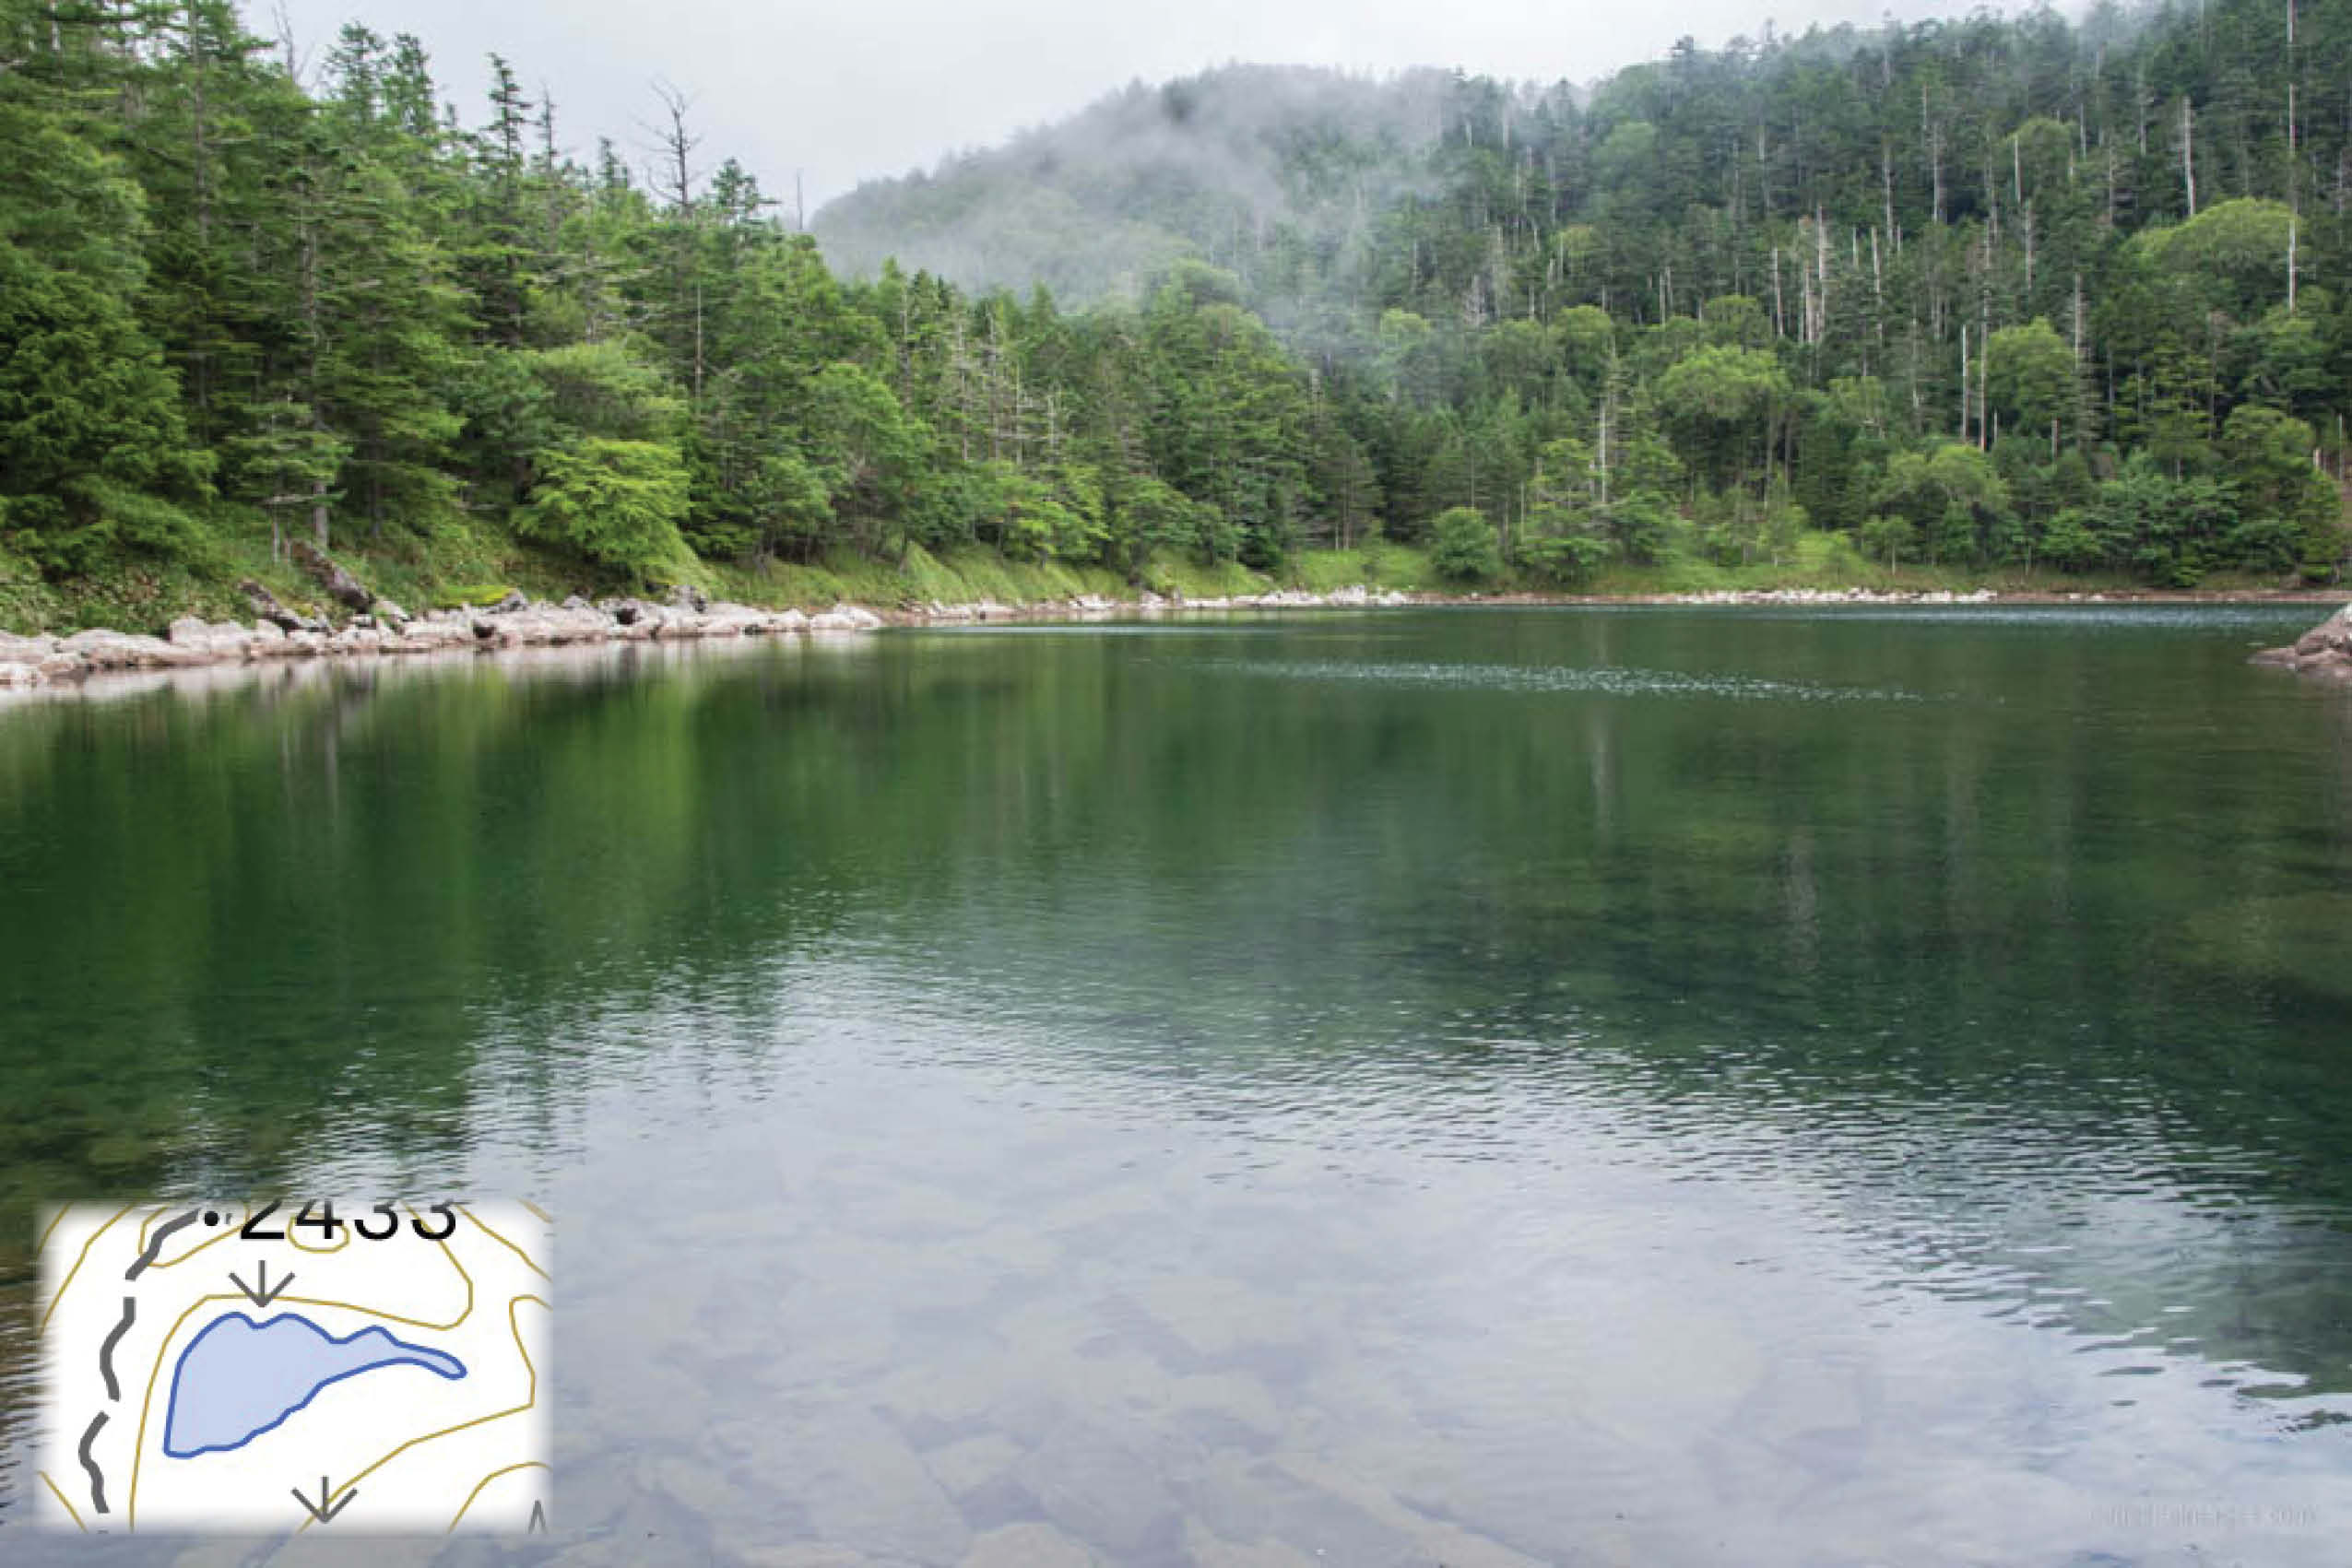
Regardless whether it’s natural or artificial, ponds and swamps with a size of 25 x 25 metres or more that remain full are indicated on the map. Ponds located near mountain trails can be used to get a general sense of your location.
13. Wetland 湿地 shicchi
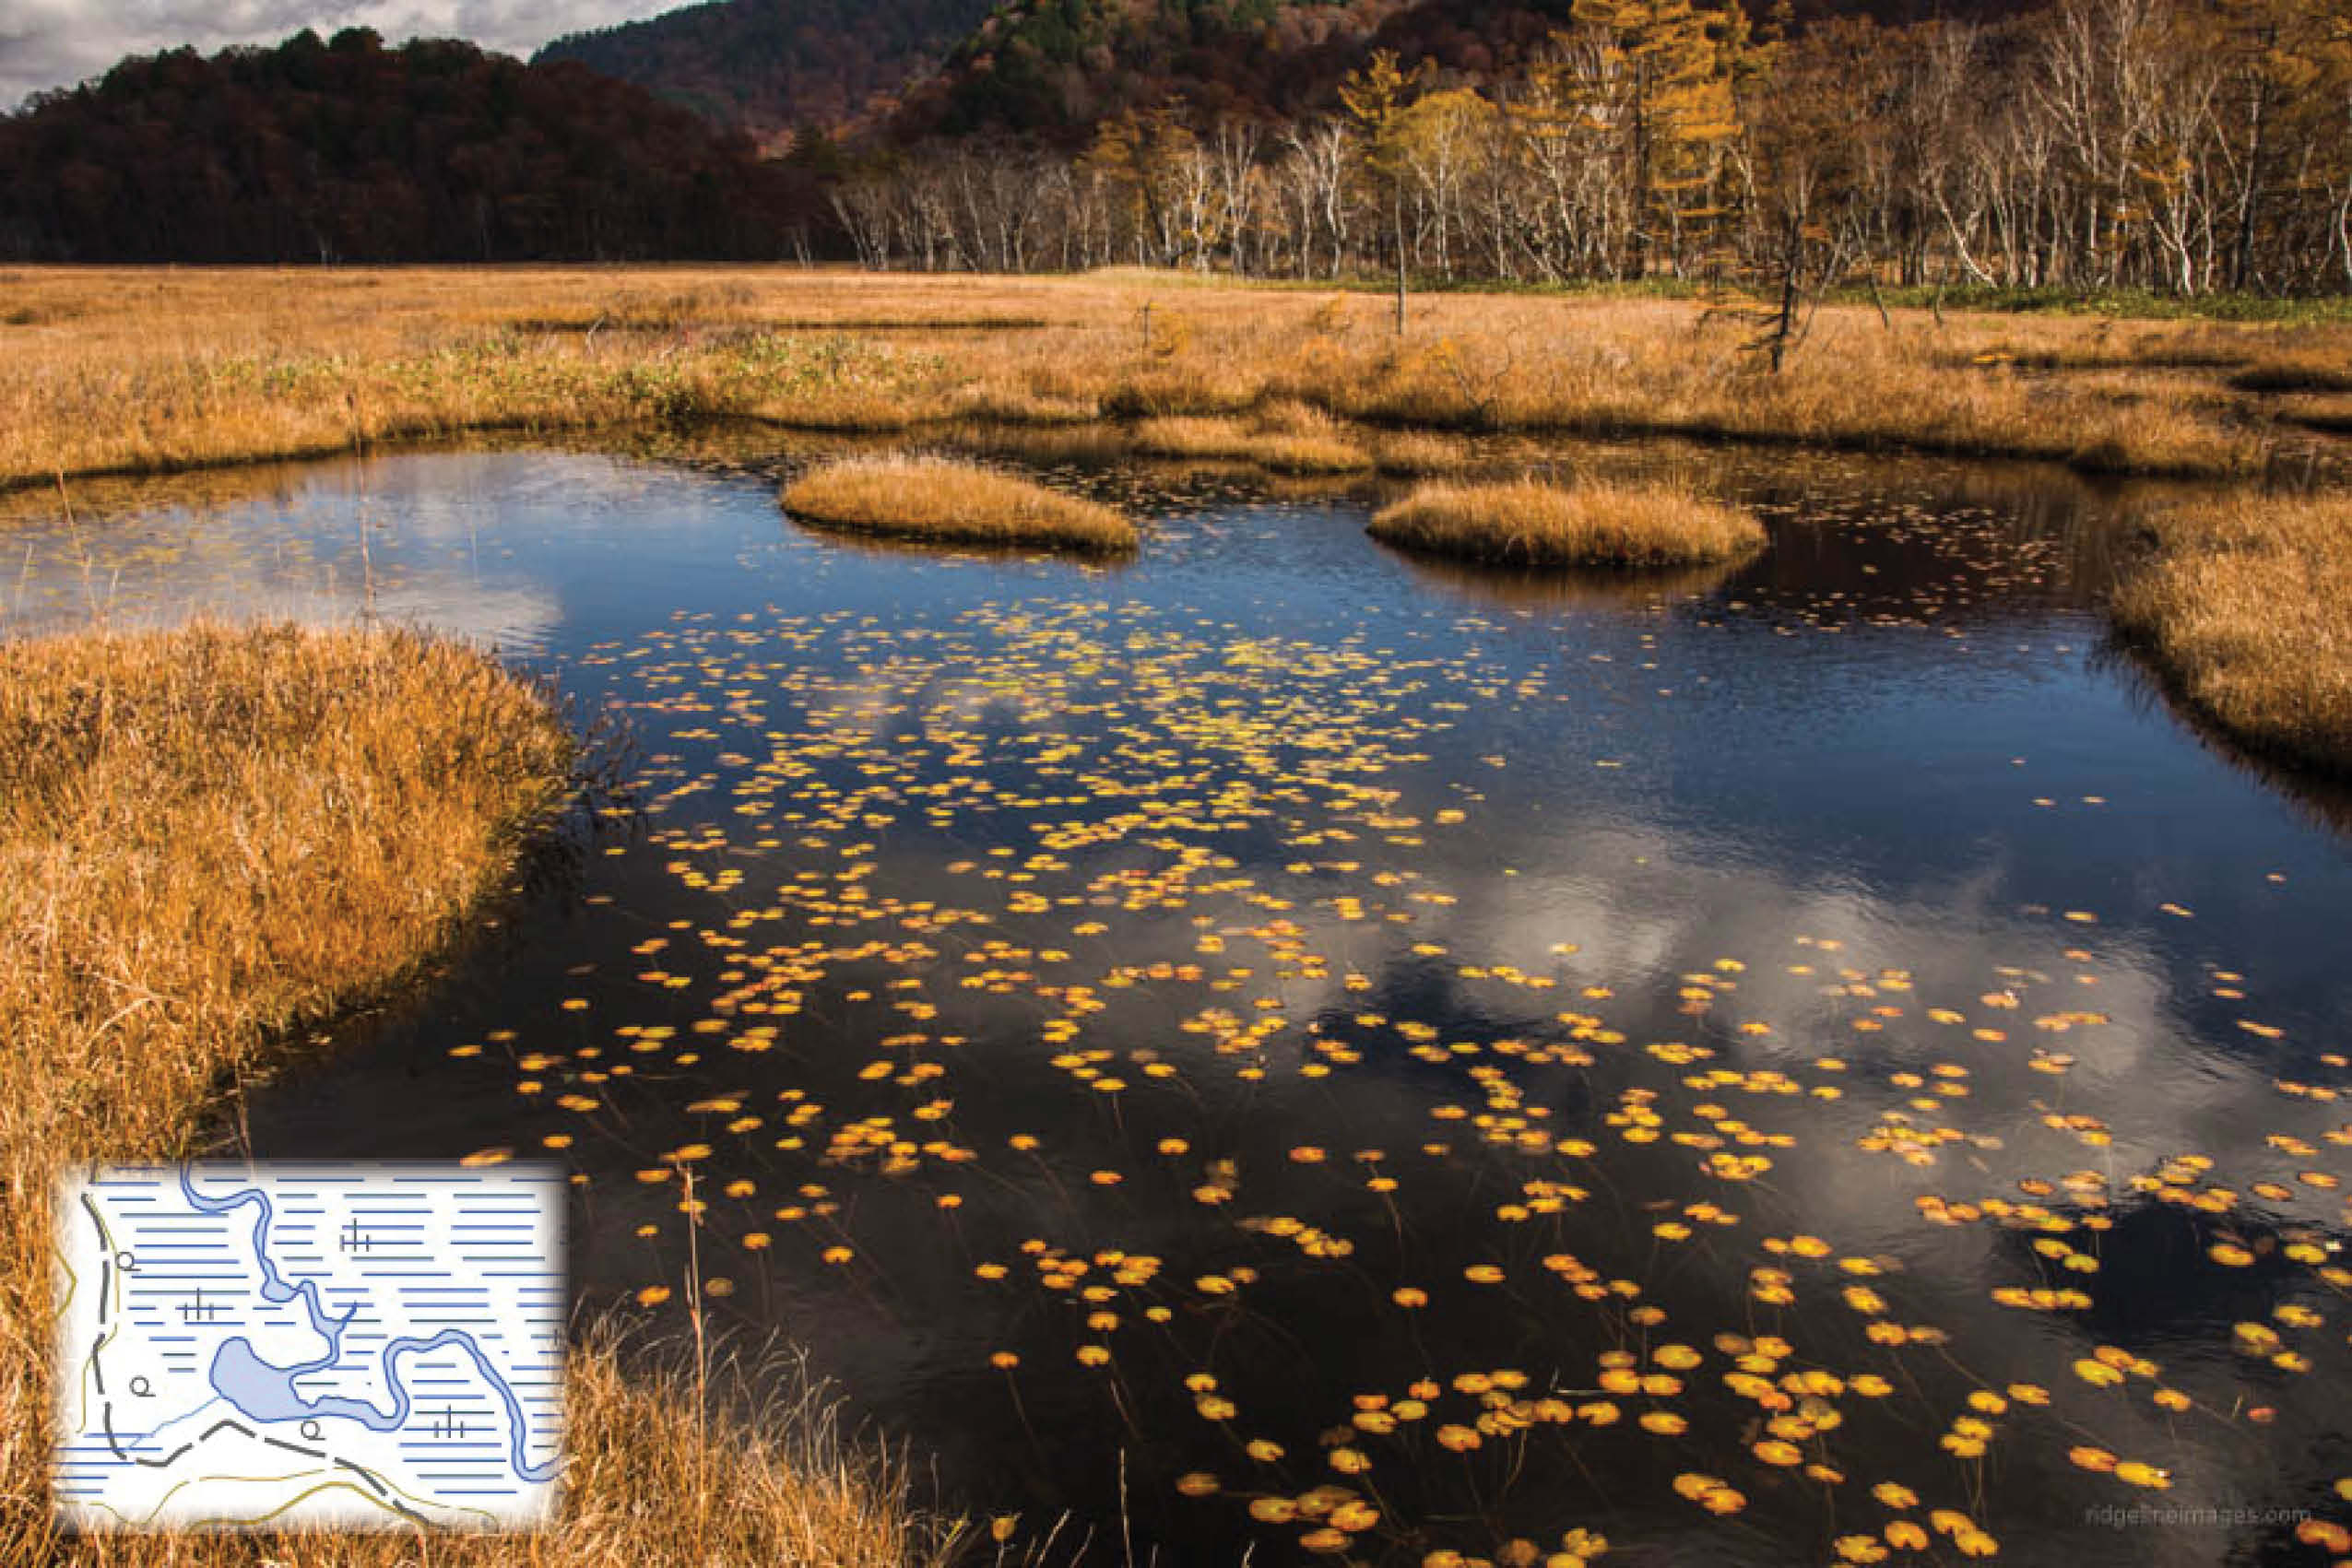
For an area to be designated as a wetland it needs to maintain a size of 75 x 75 metres or more.
14. Perennial Snow Patch 万年雪 mannen-yuki
 Perennial snow patches occur in snowy valleys where snow and ice remain year-round. There are various sizes, but to be indicated by this symbol it should be 50 x 50 metres or more in September. It is seldom seen except in some alpine areas, and the boundaries shown on the map may differ depending on the climate.
15. Weir / Dam せき seki
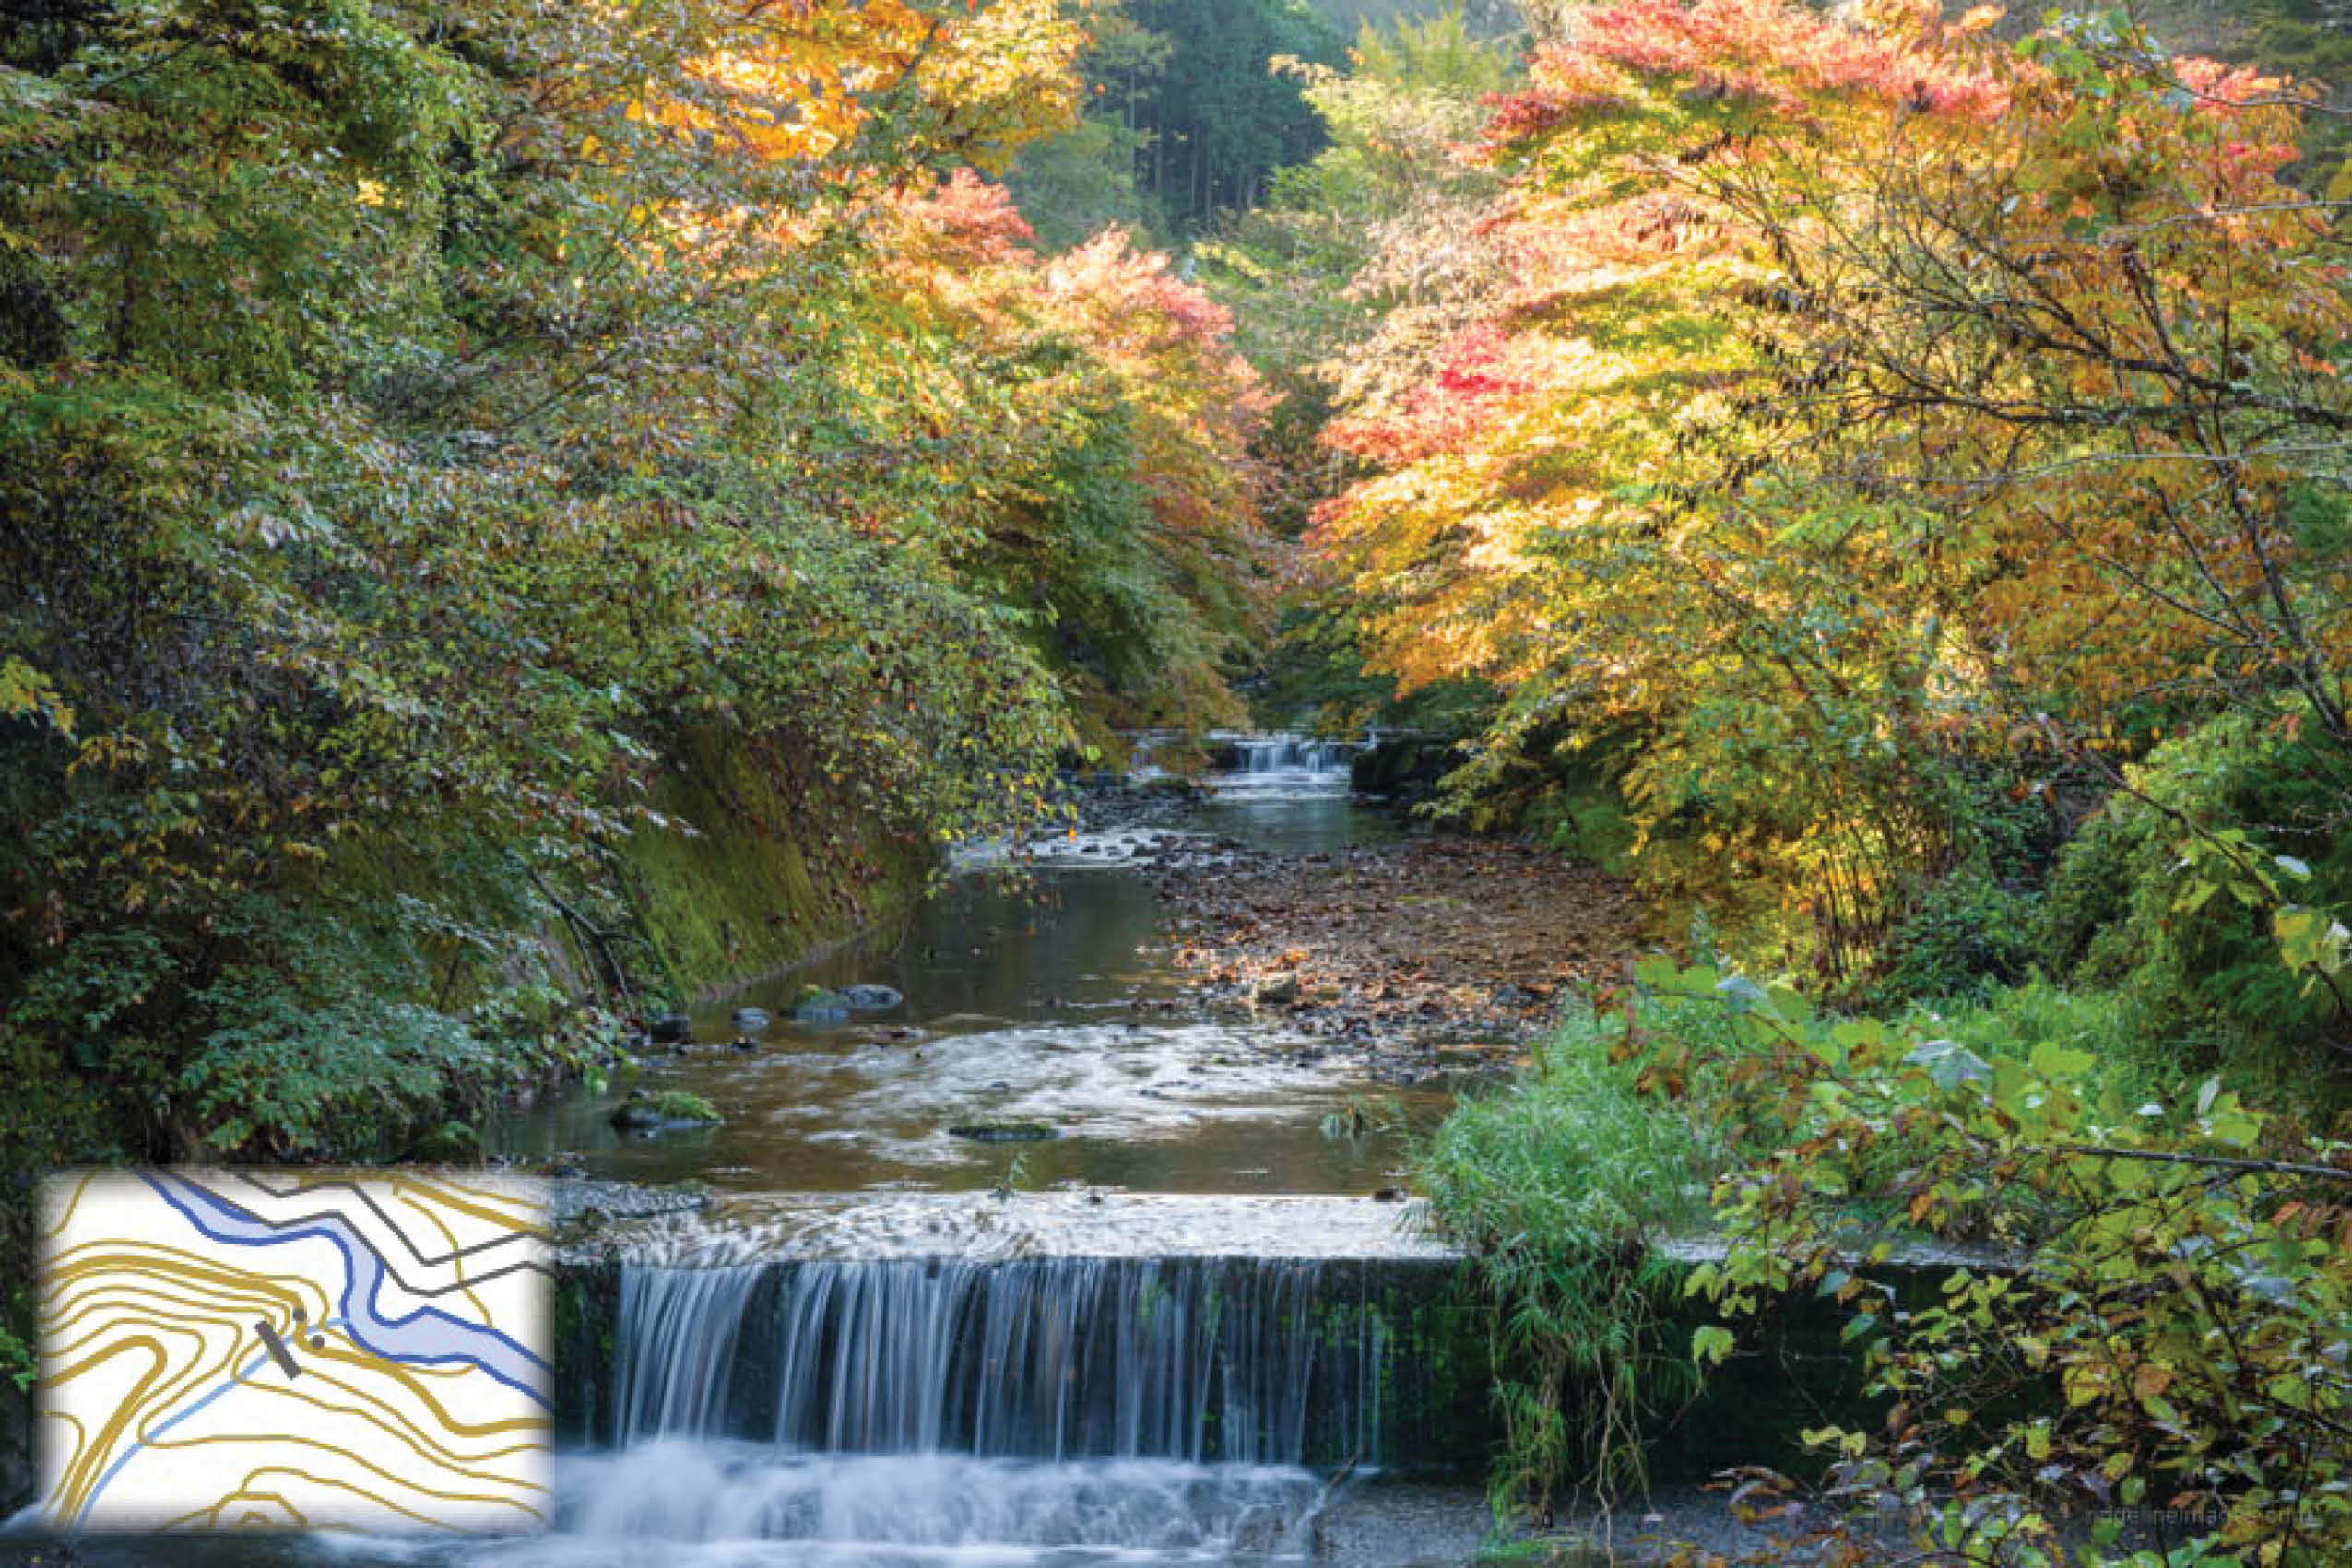
Ever-present along rivers and valleys in Japan to regulate the flow for irrigation, hydropower, and water supply.
Buildings and Landmarks
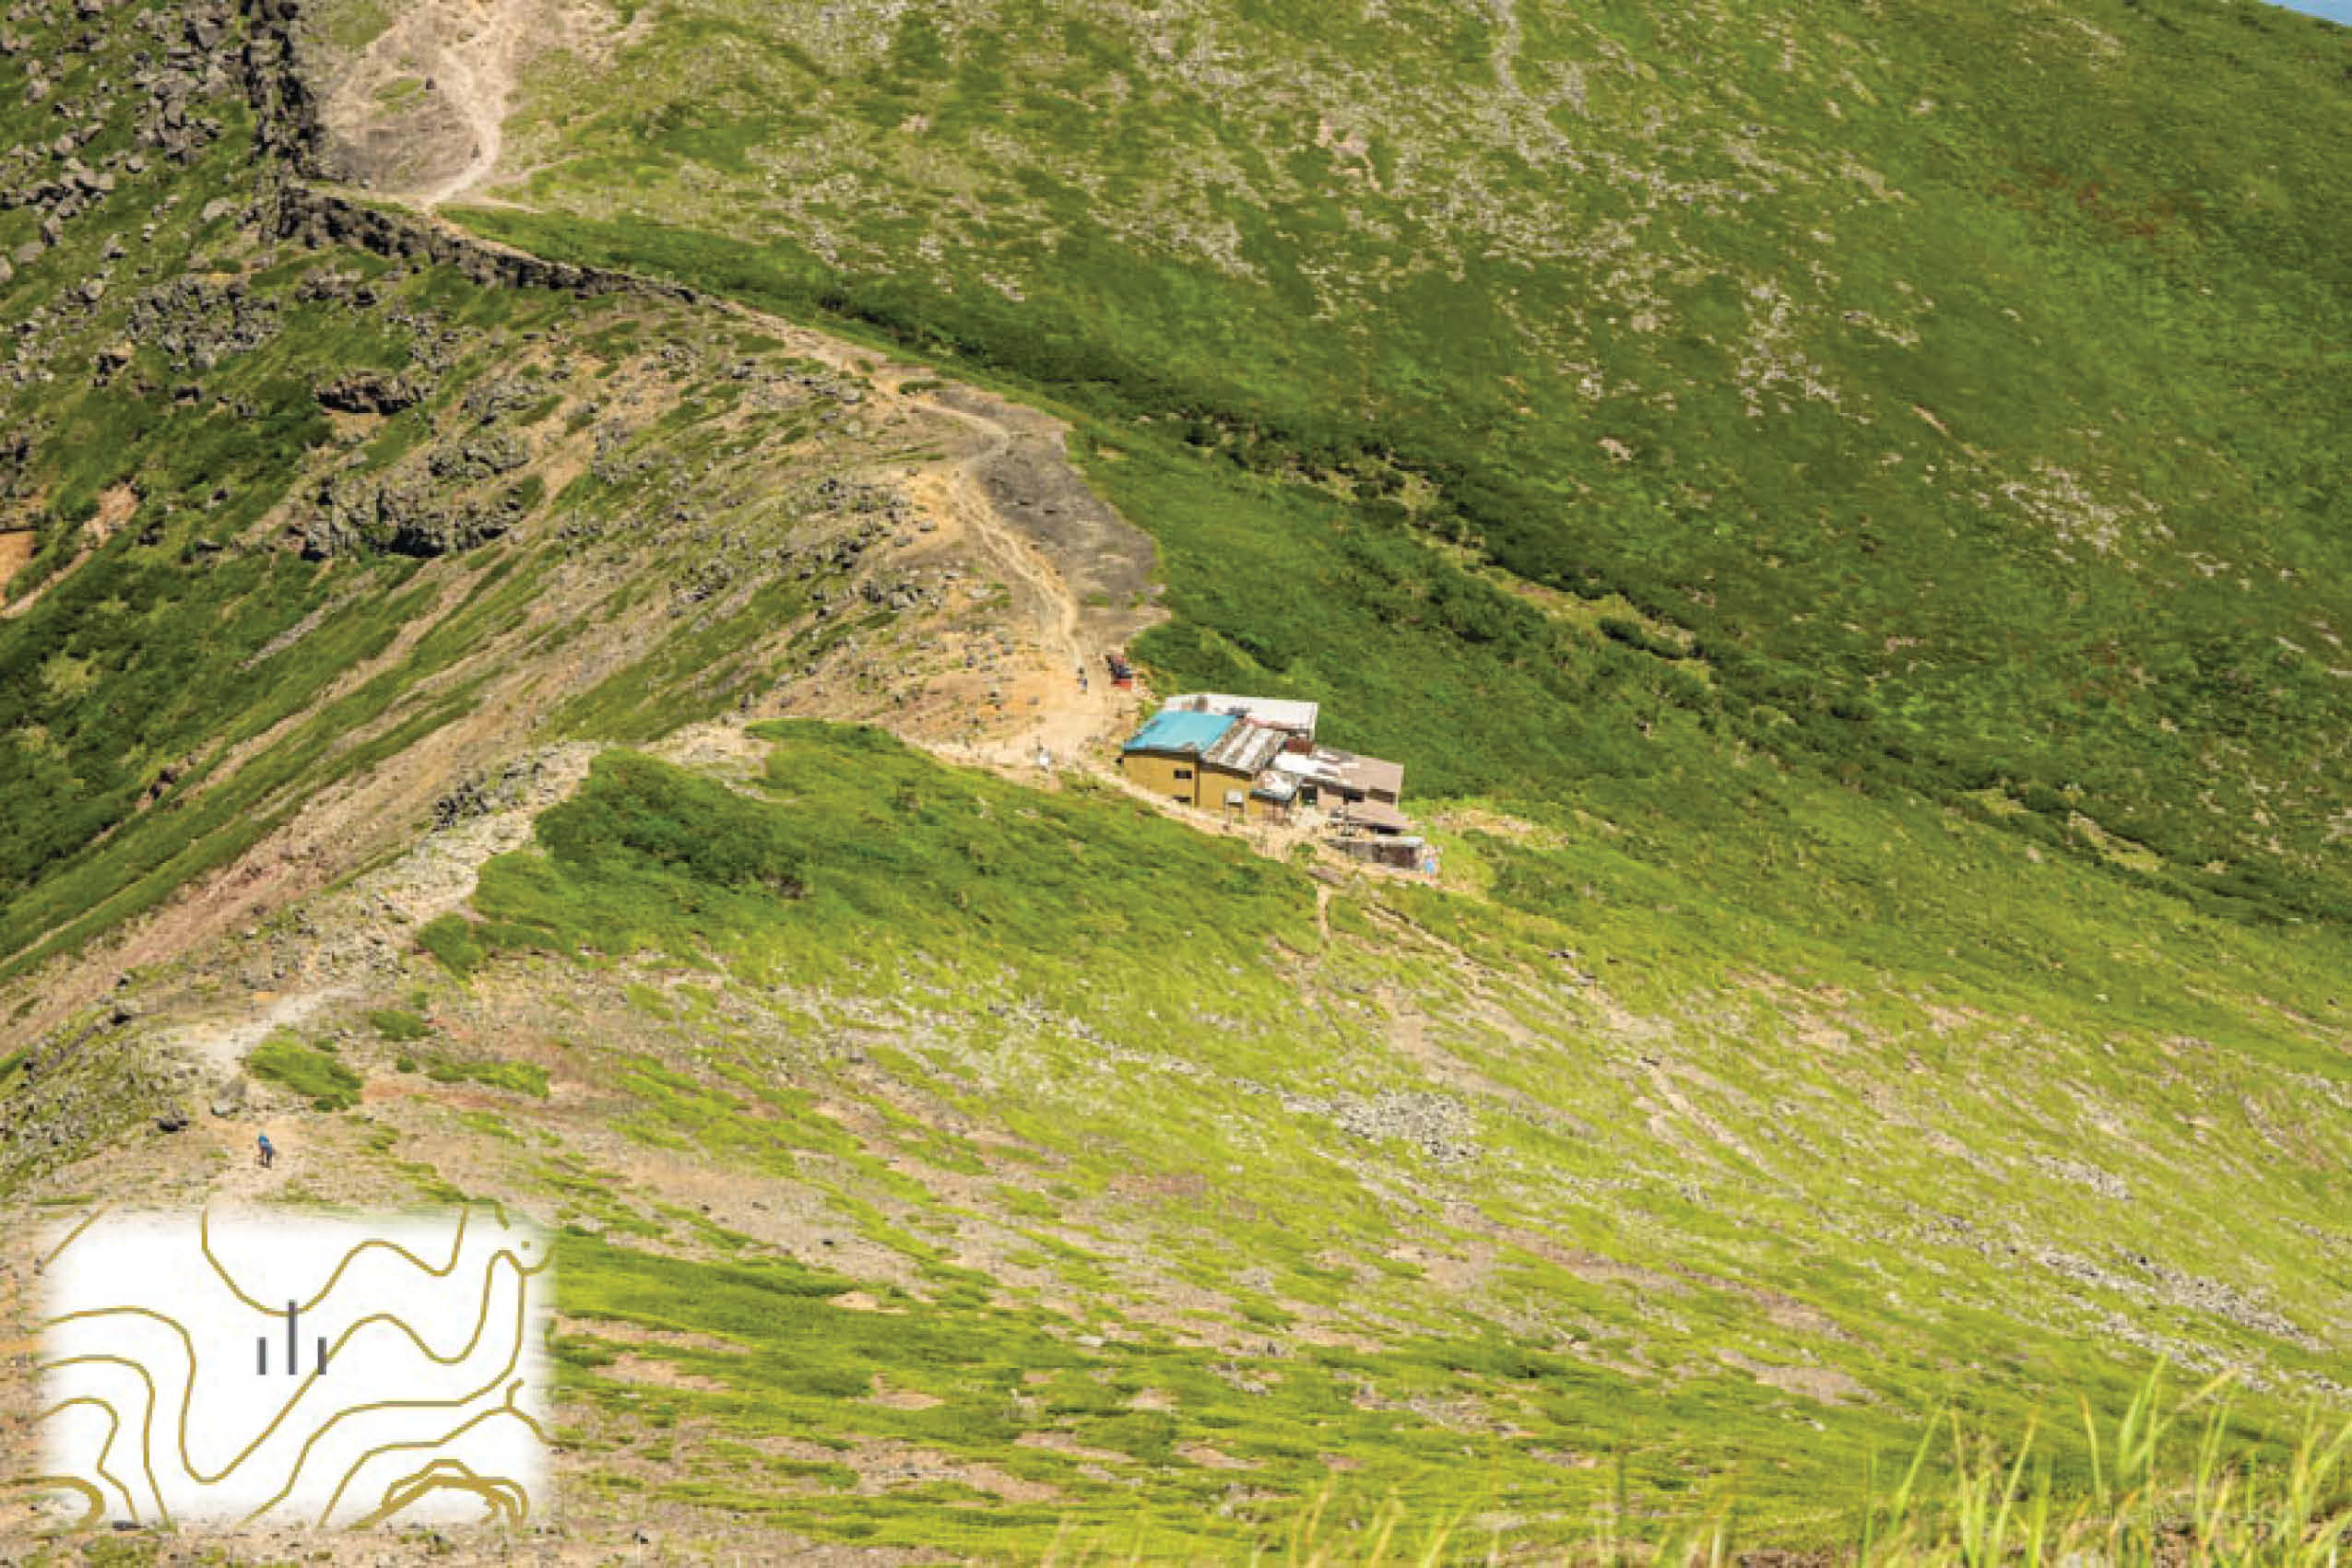
16. Building 建物 tatemono
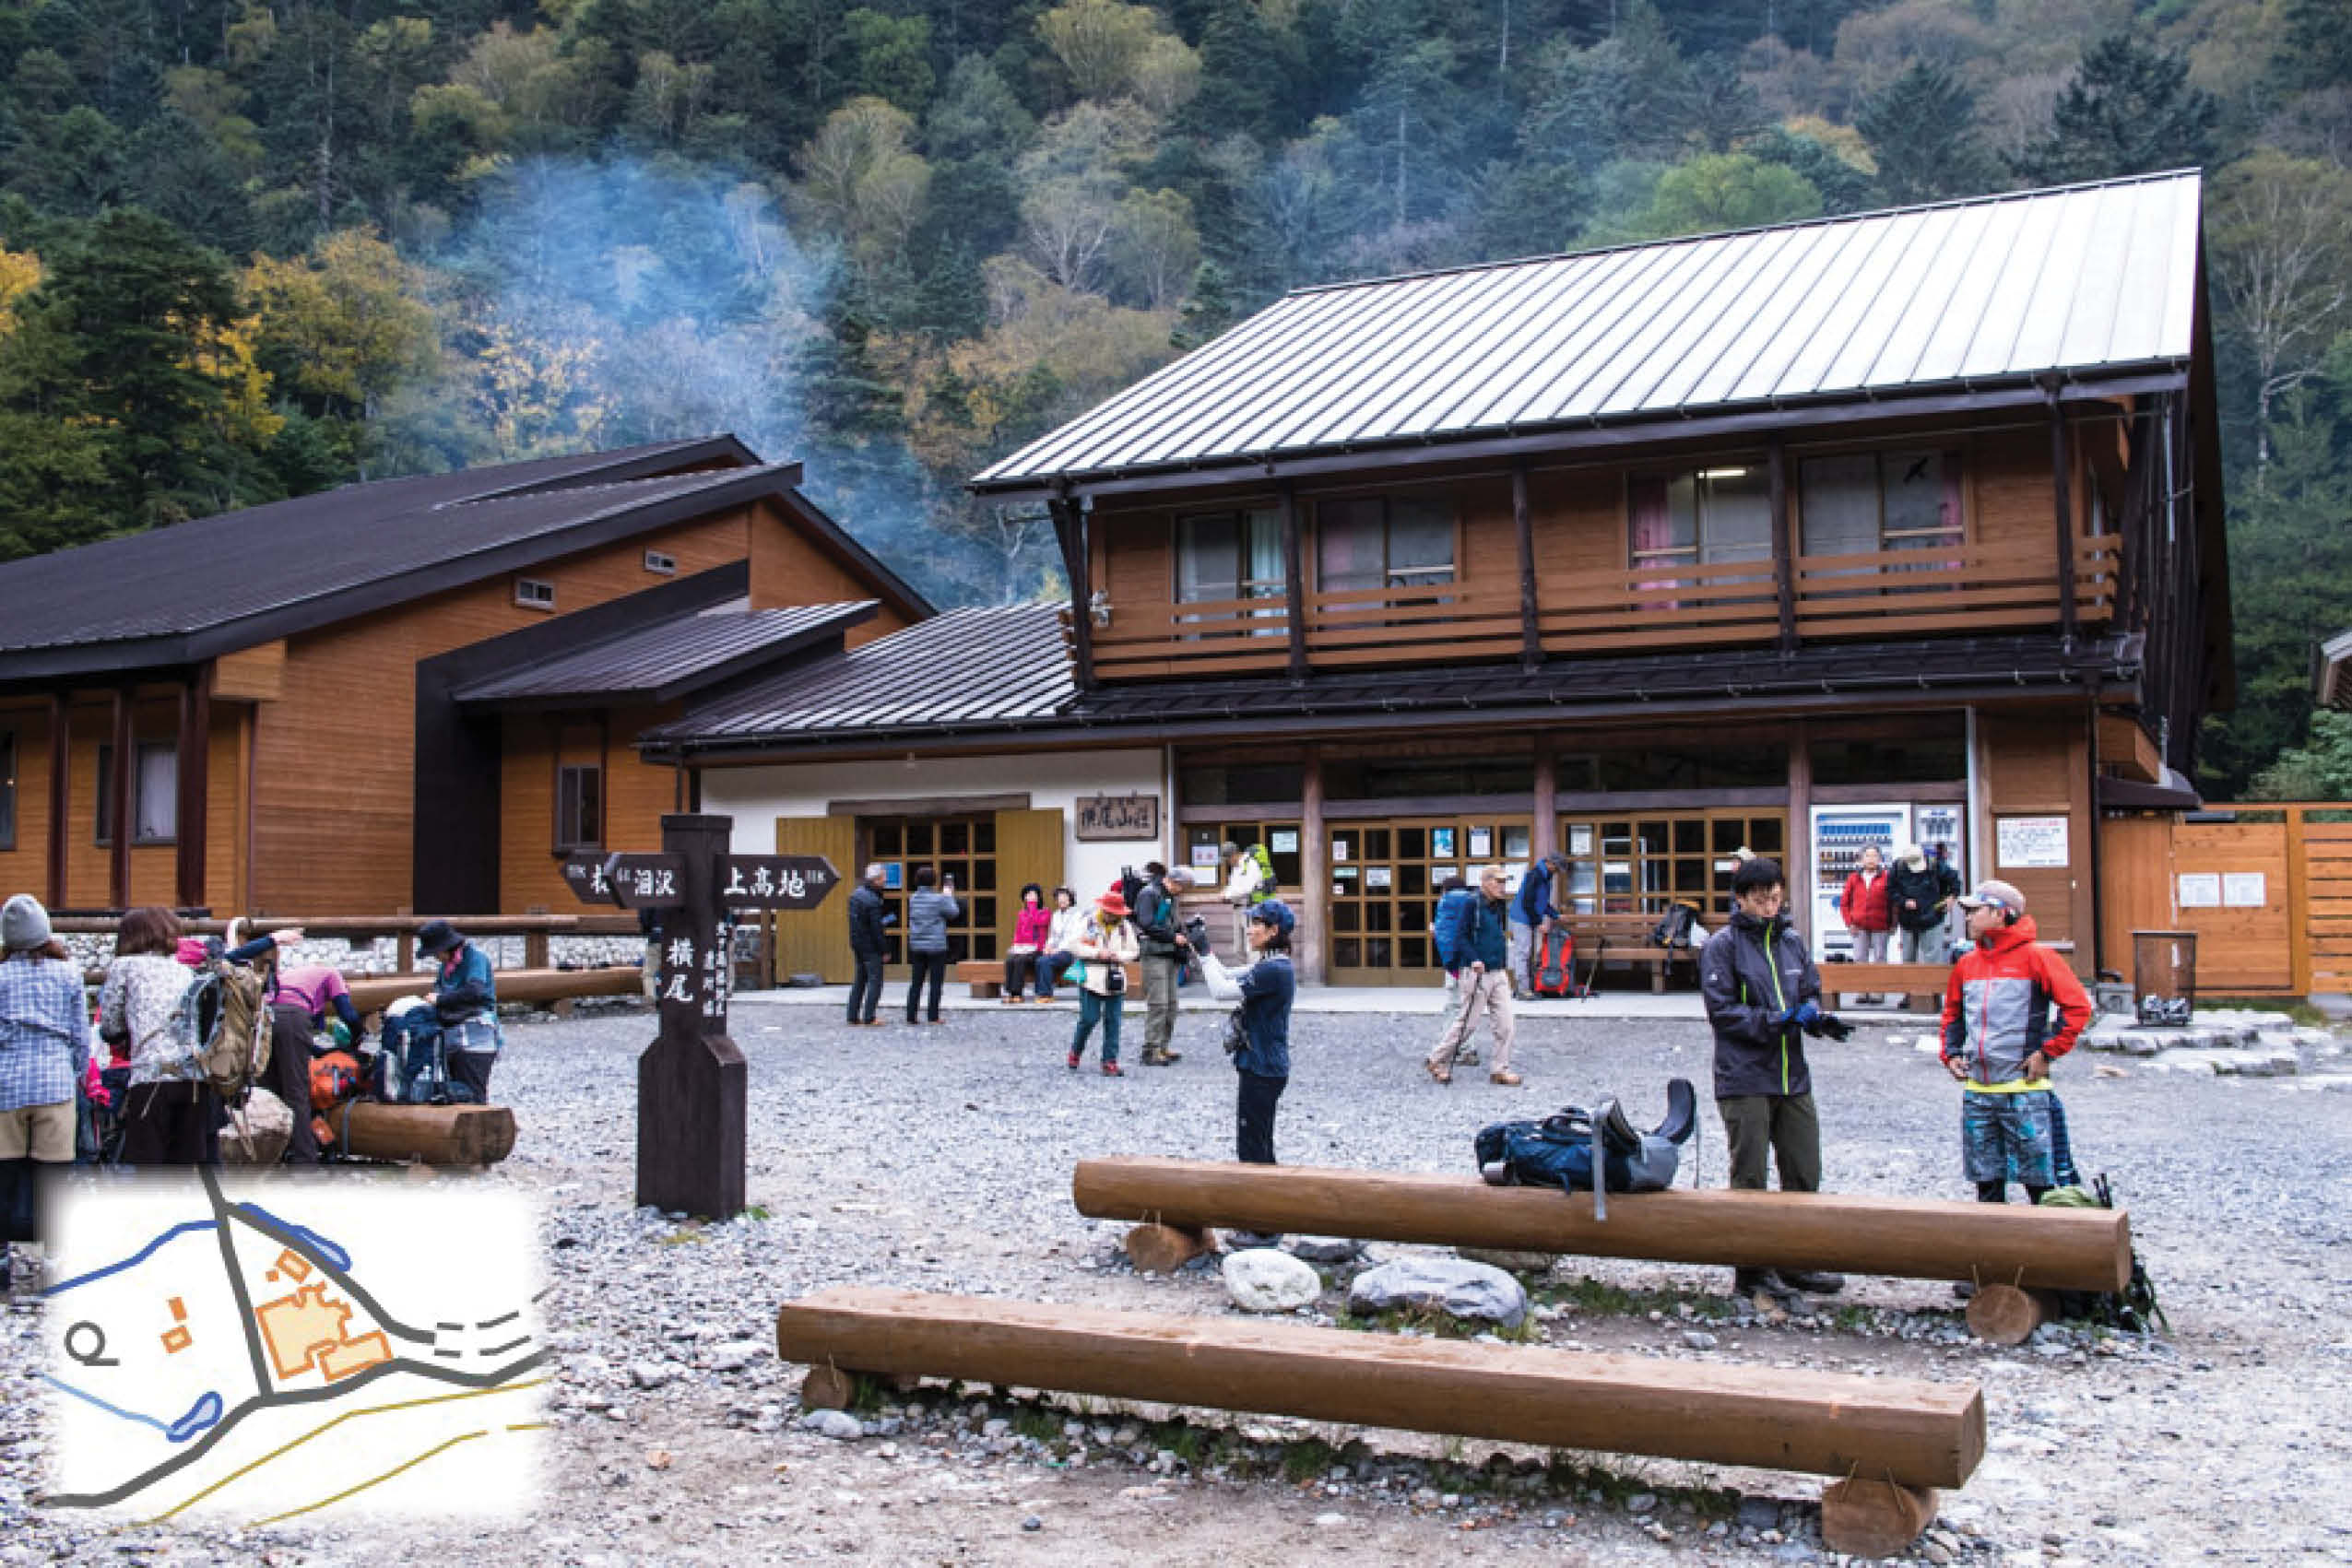
Small buildings such as mountain huts and refuge shelters are usually indicated, making it simple to know your precise location. Note that minor structures such as agricultural equipment sheds, lean-tos, and gazebos may be omitted.
17. Transmission Line 送電線 sōden-sen
![]()
Power transmission lines run deep into the Japanese mountains, soaring even above 1,500 metres, making them useful landmarks. Hiking trails often pass near transmission towers making it easy to grasp your whereabouts.
18. Radio Mast 電波塔 denpotō
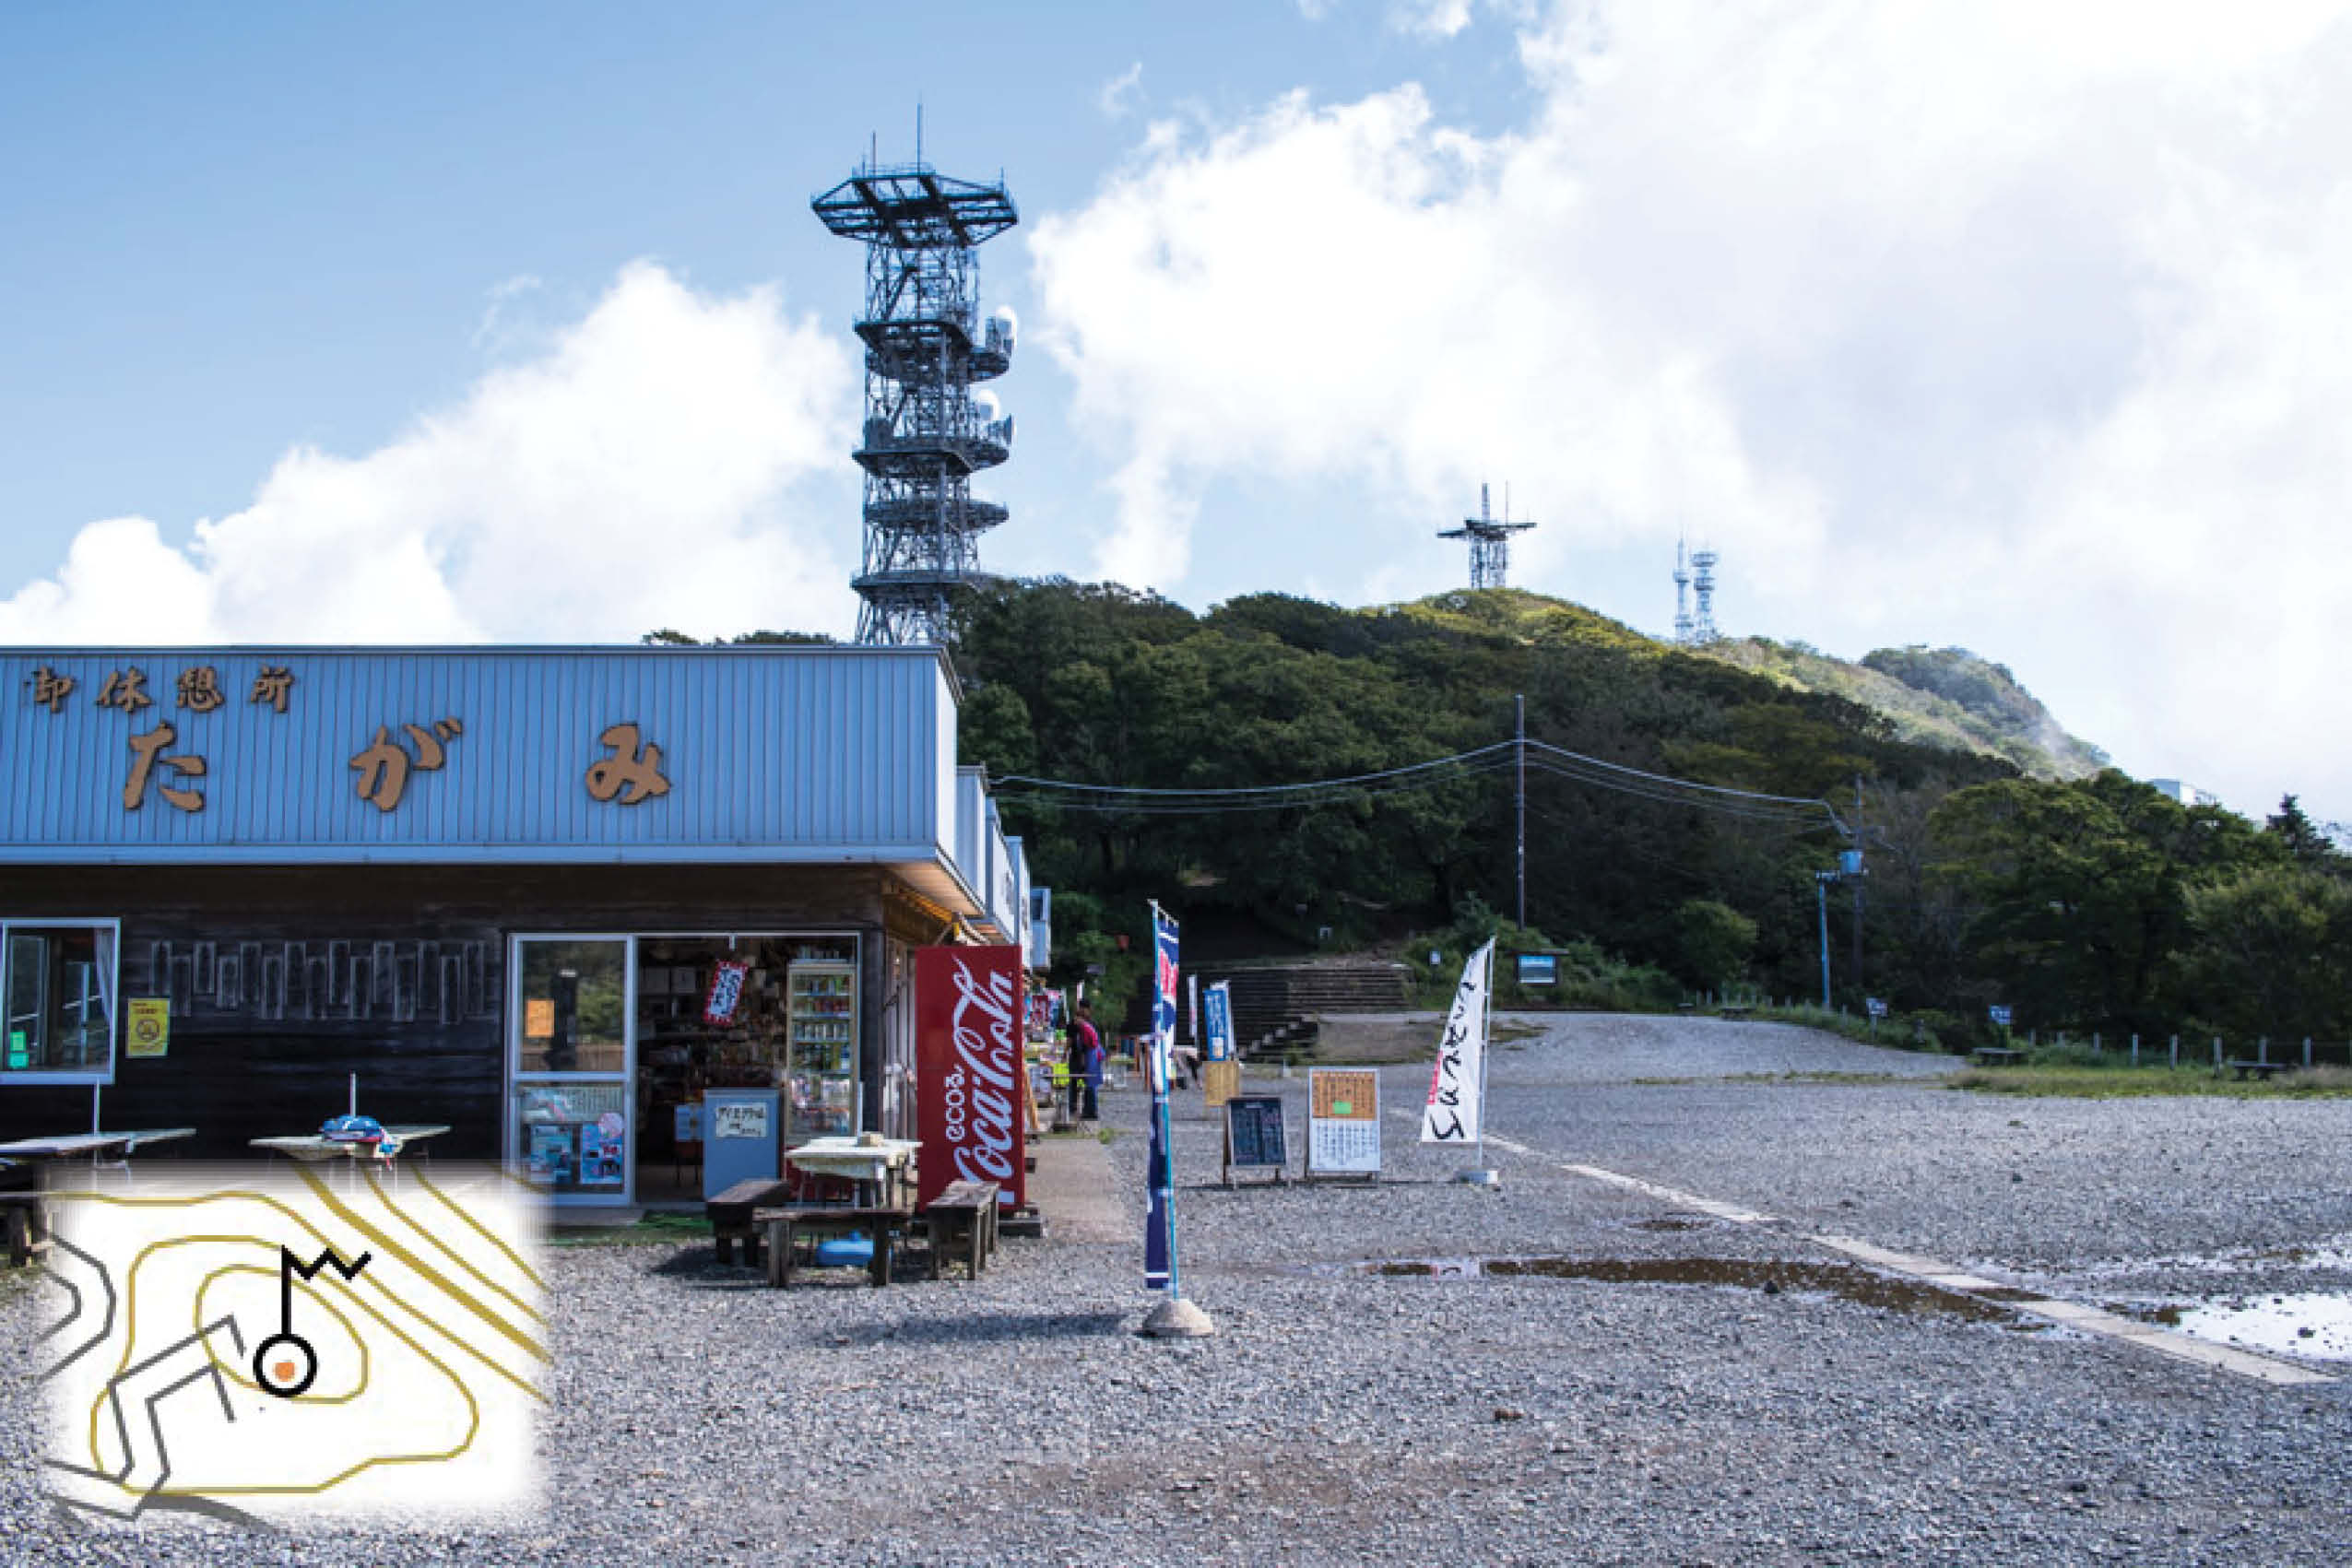
Radio masts and towers are often erected on the summit of low-lying mountains and can be glimpsed from long distances, making them handy landmarks even if they’re a blight on the landscape.
19. Windmill 風車 fūsha

Electricity generating wind turbines can be seen dotted on coastal hillsides or grouped together as part of a ‘wind farm’. Their propeller-like blades can be easily spotted making them useful to get your bearings.
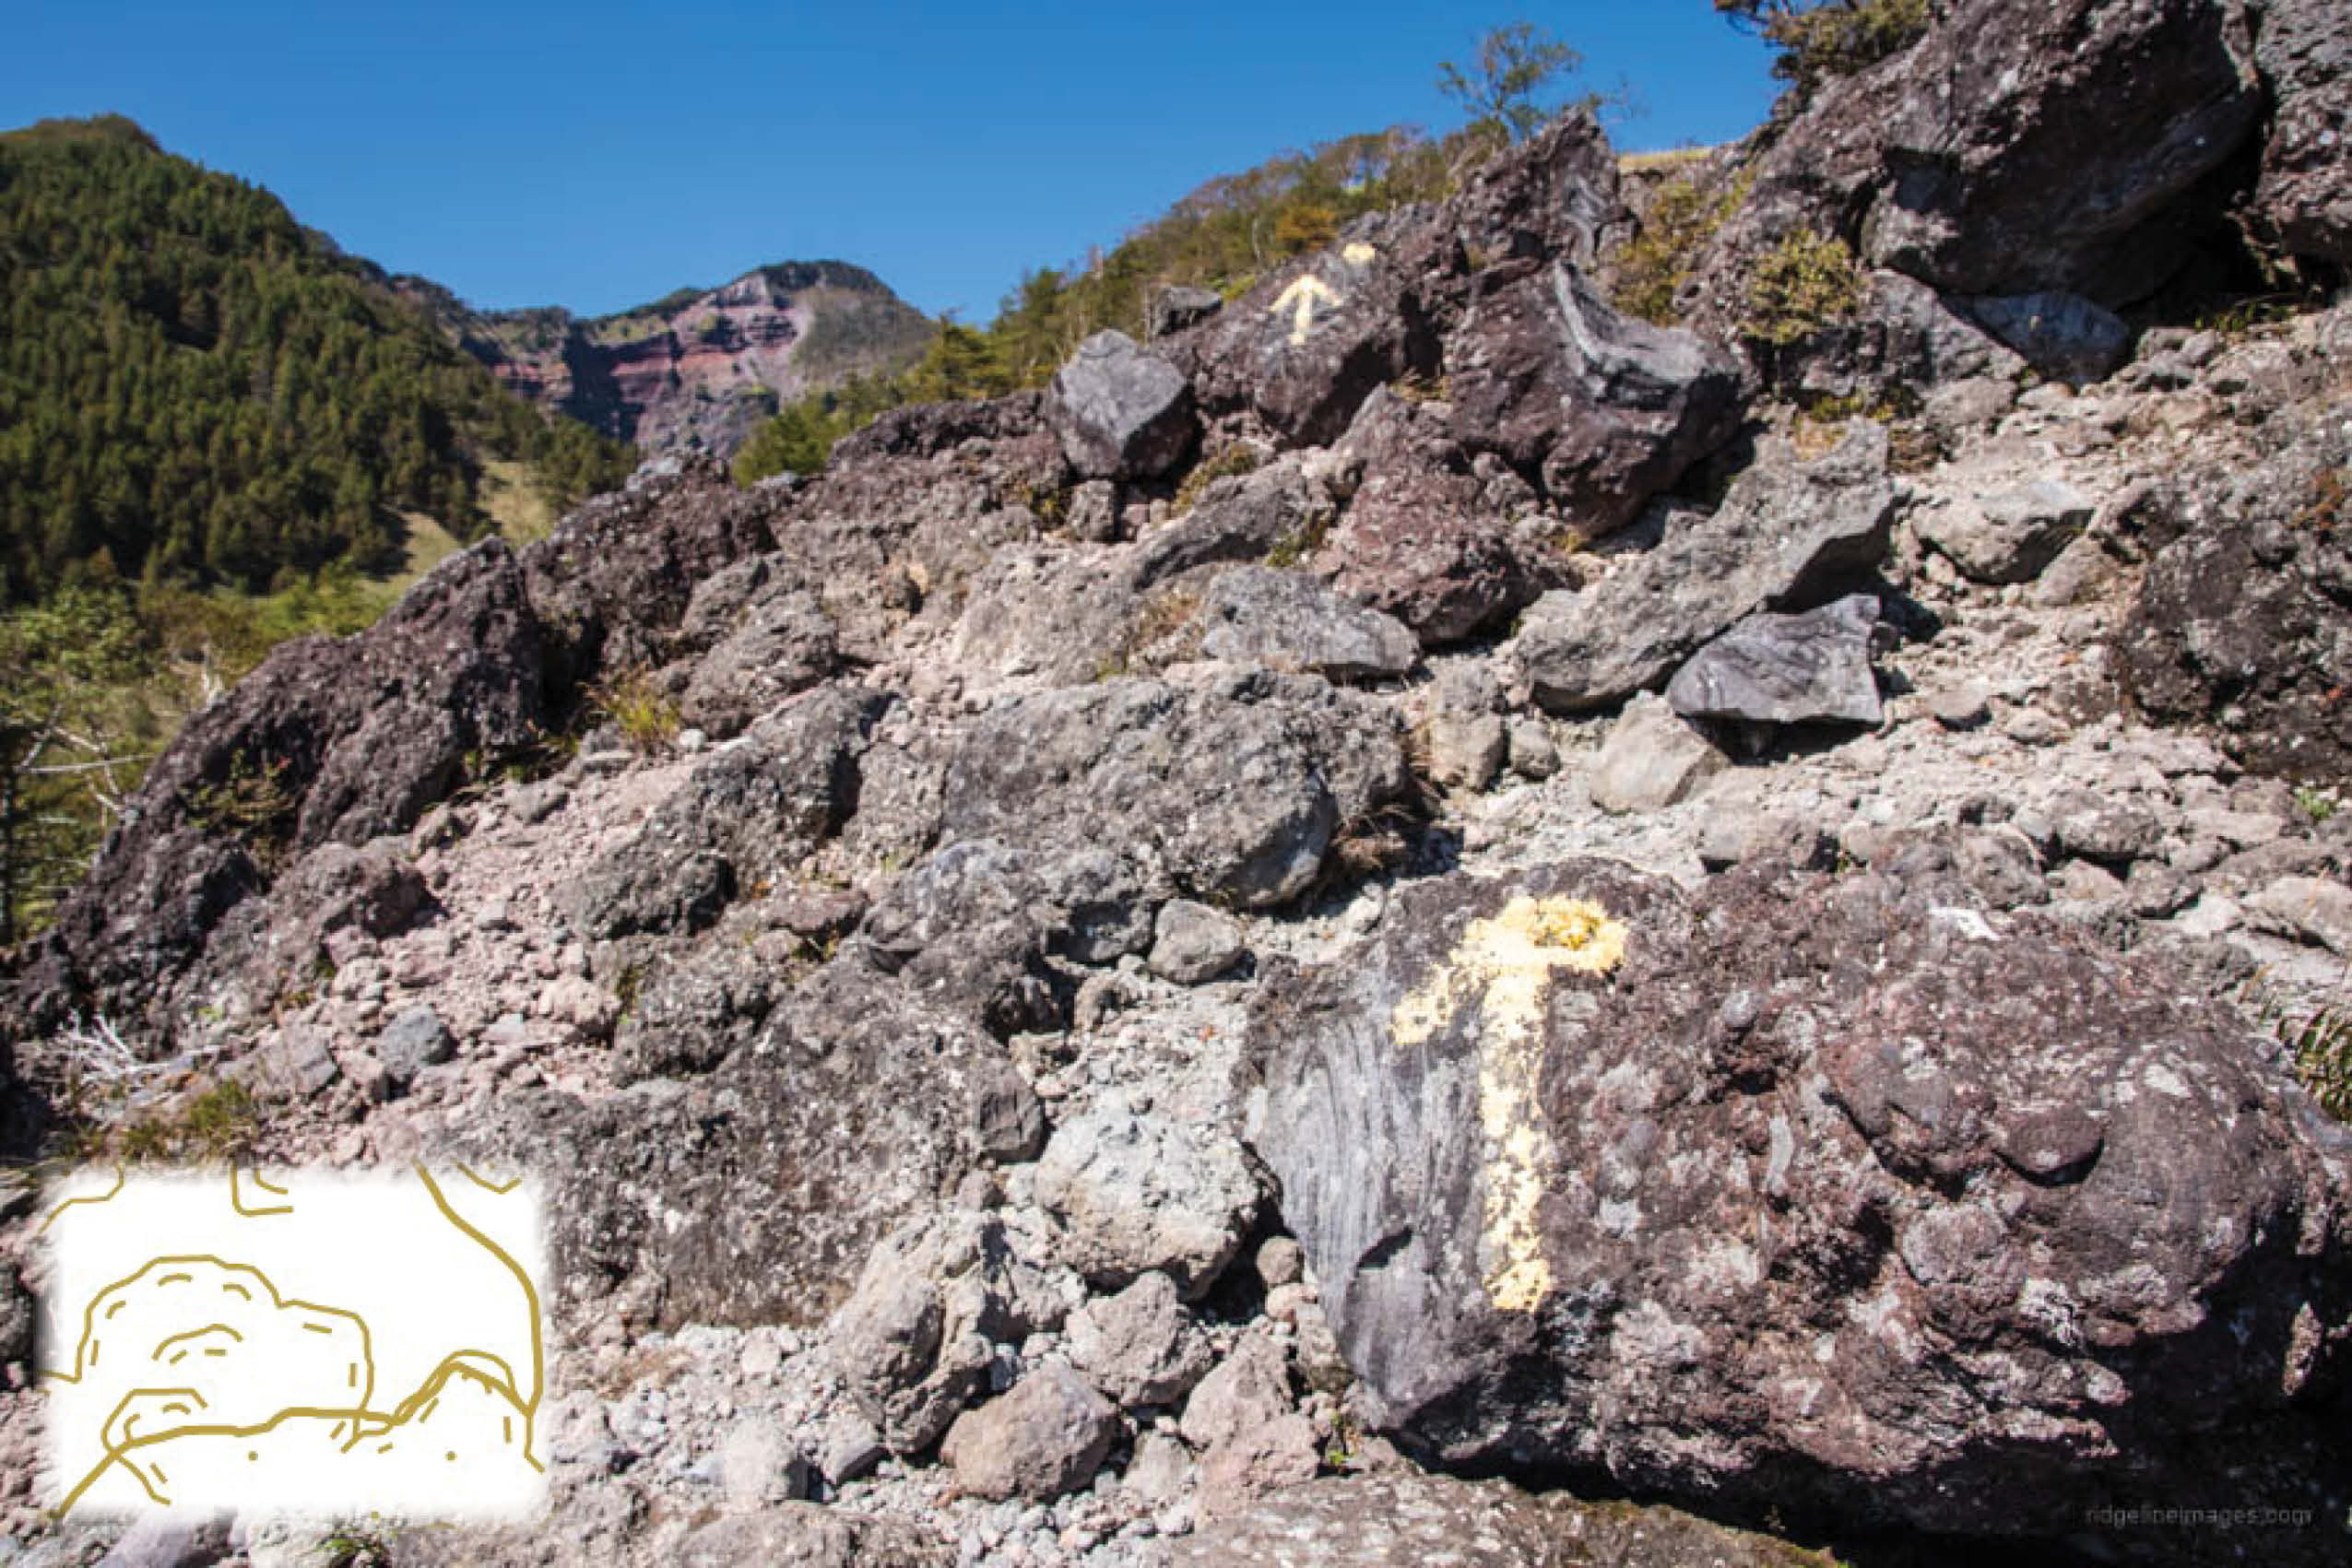
20. Triangulation Station 三角点 san-kakuten
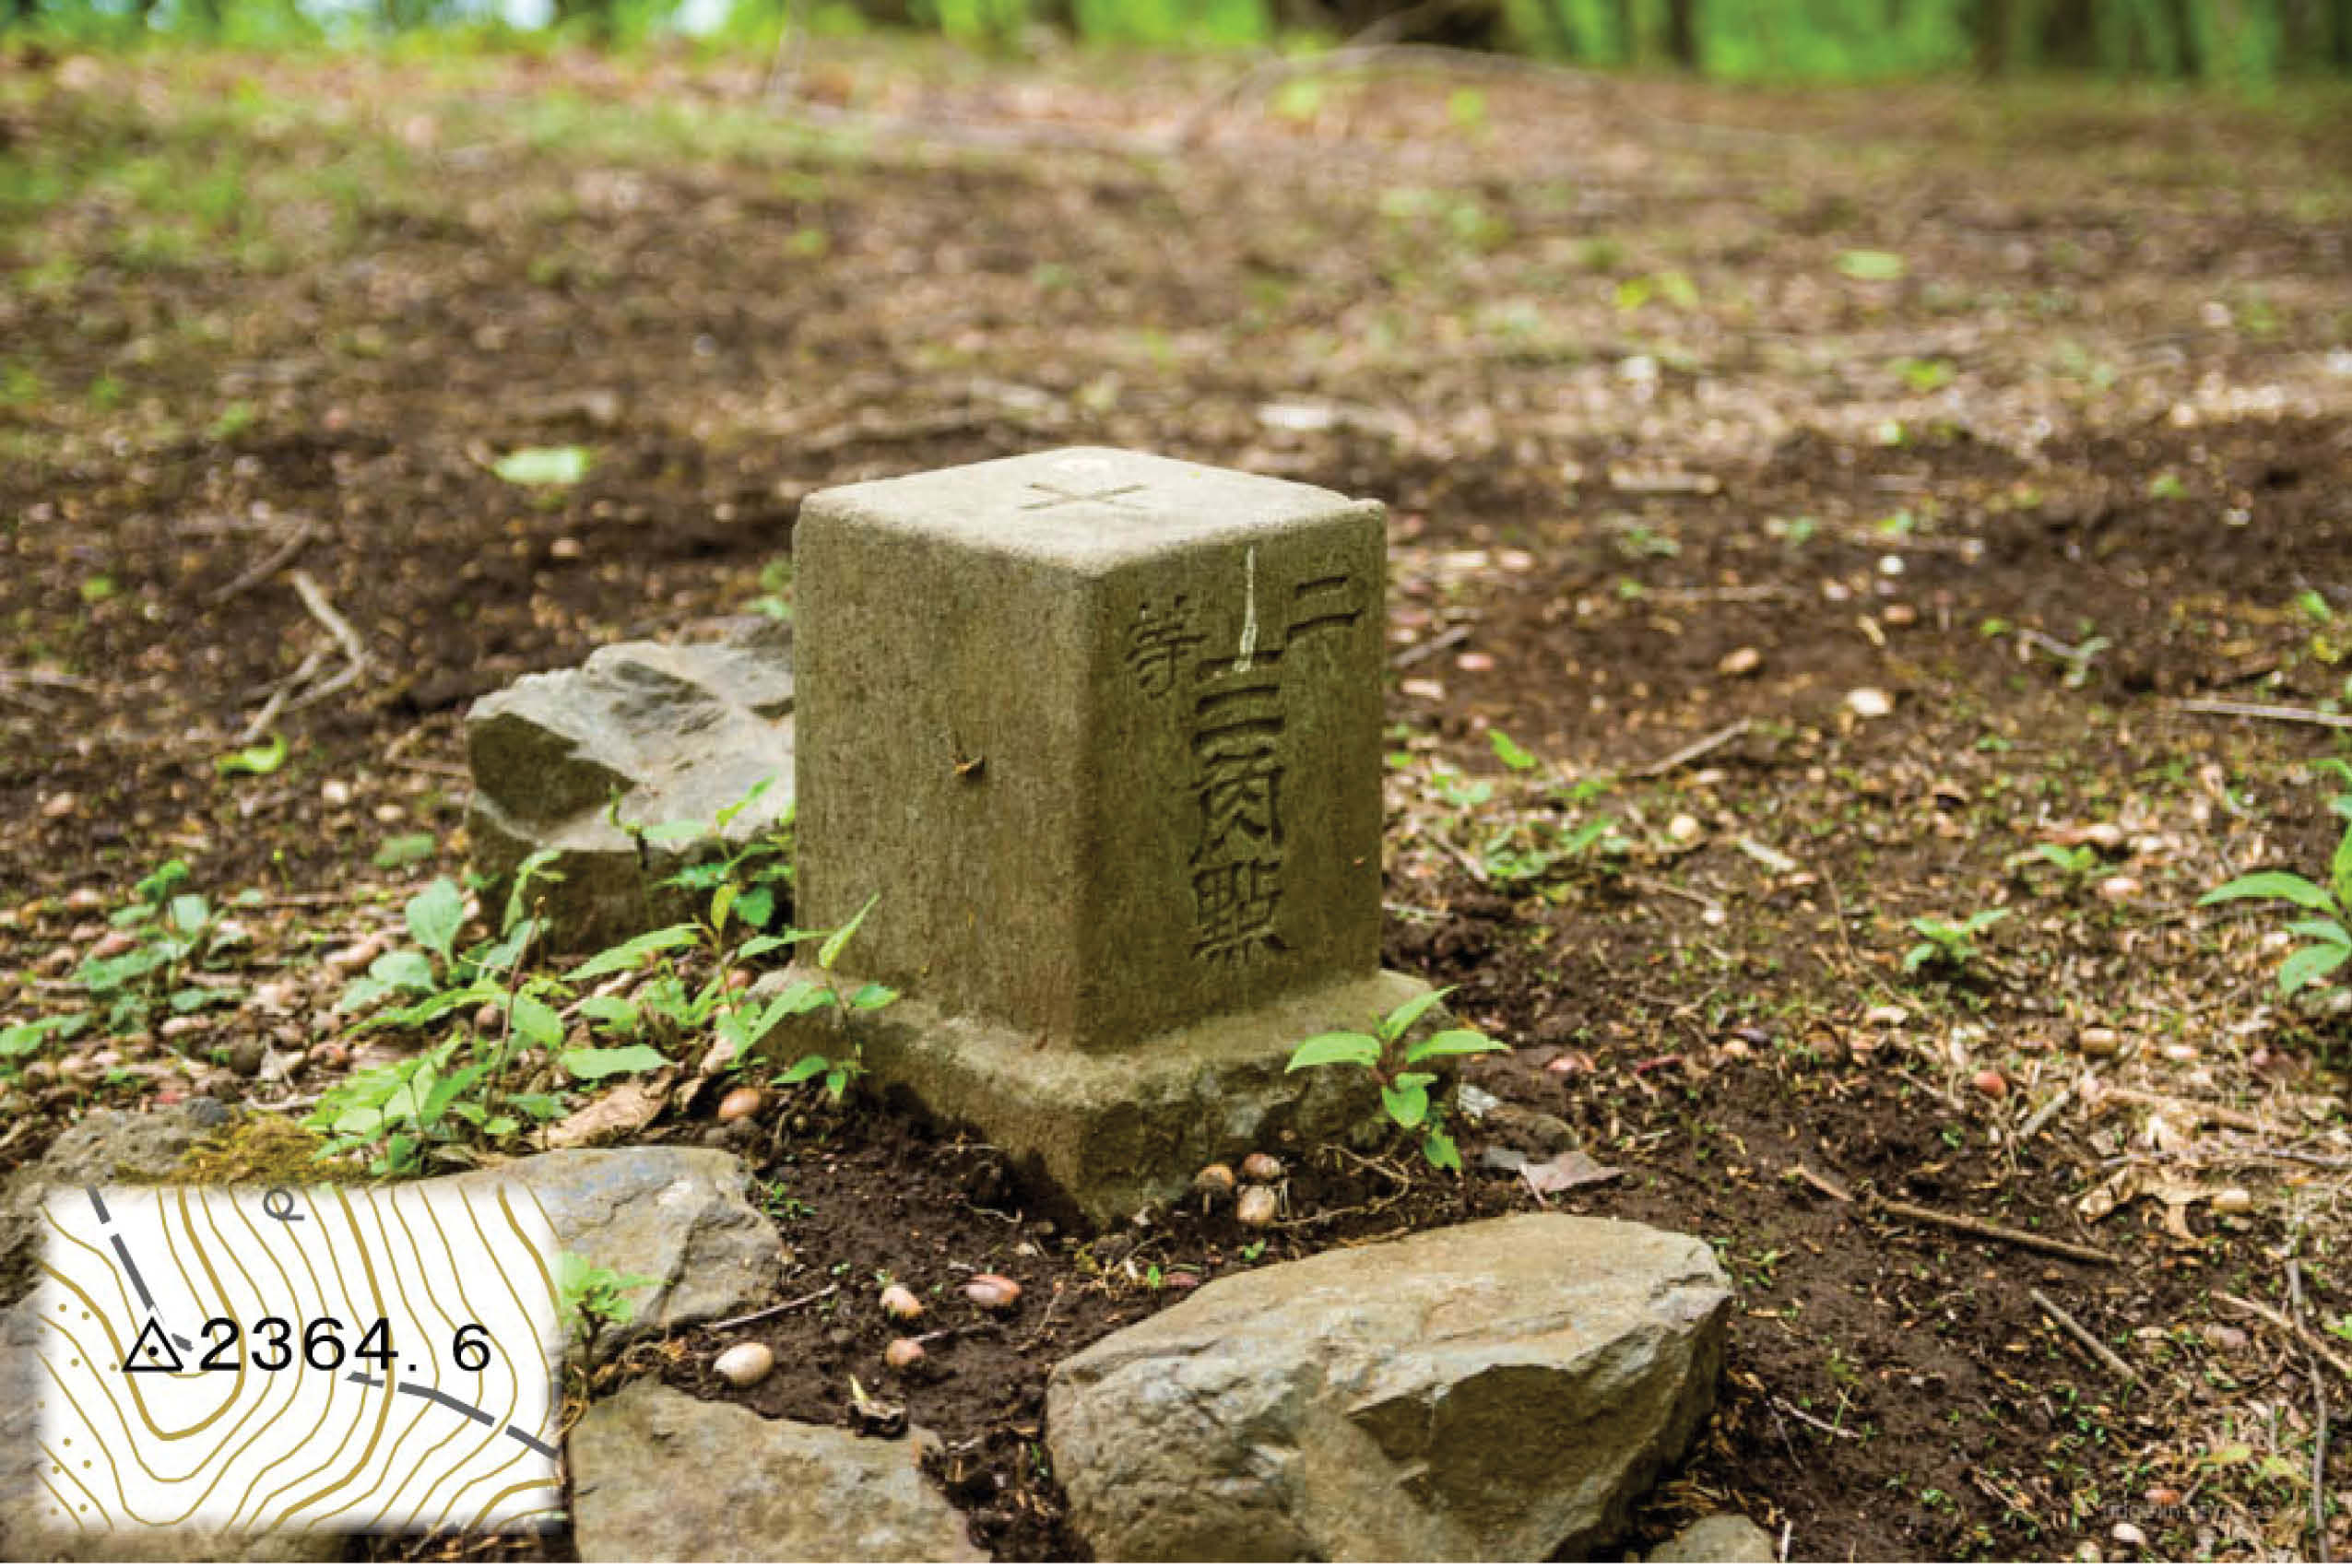
A triangulation station or trig point is a fixed surveying station with known coordinates and elevation and are useful to hikers as navigational aids. In Japan they are square pillars fashioned from granite and divided into five classes. The one in the photo is a class two trig point of which there are about 5000 installed every 8 kilometres.
Roads and Trails
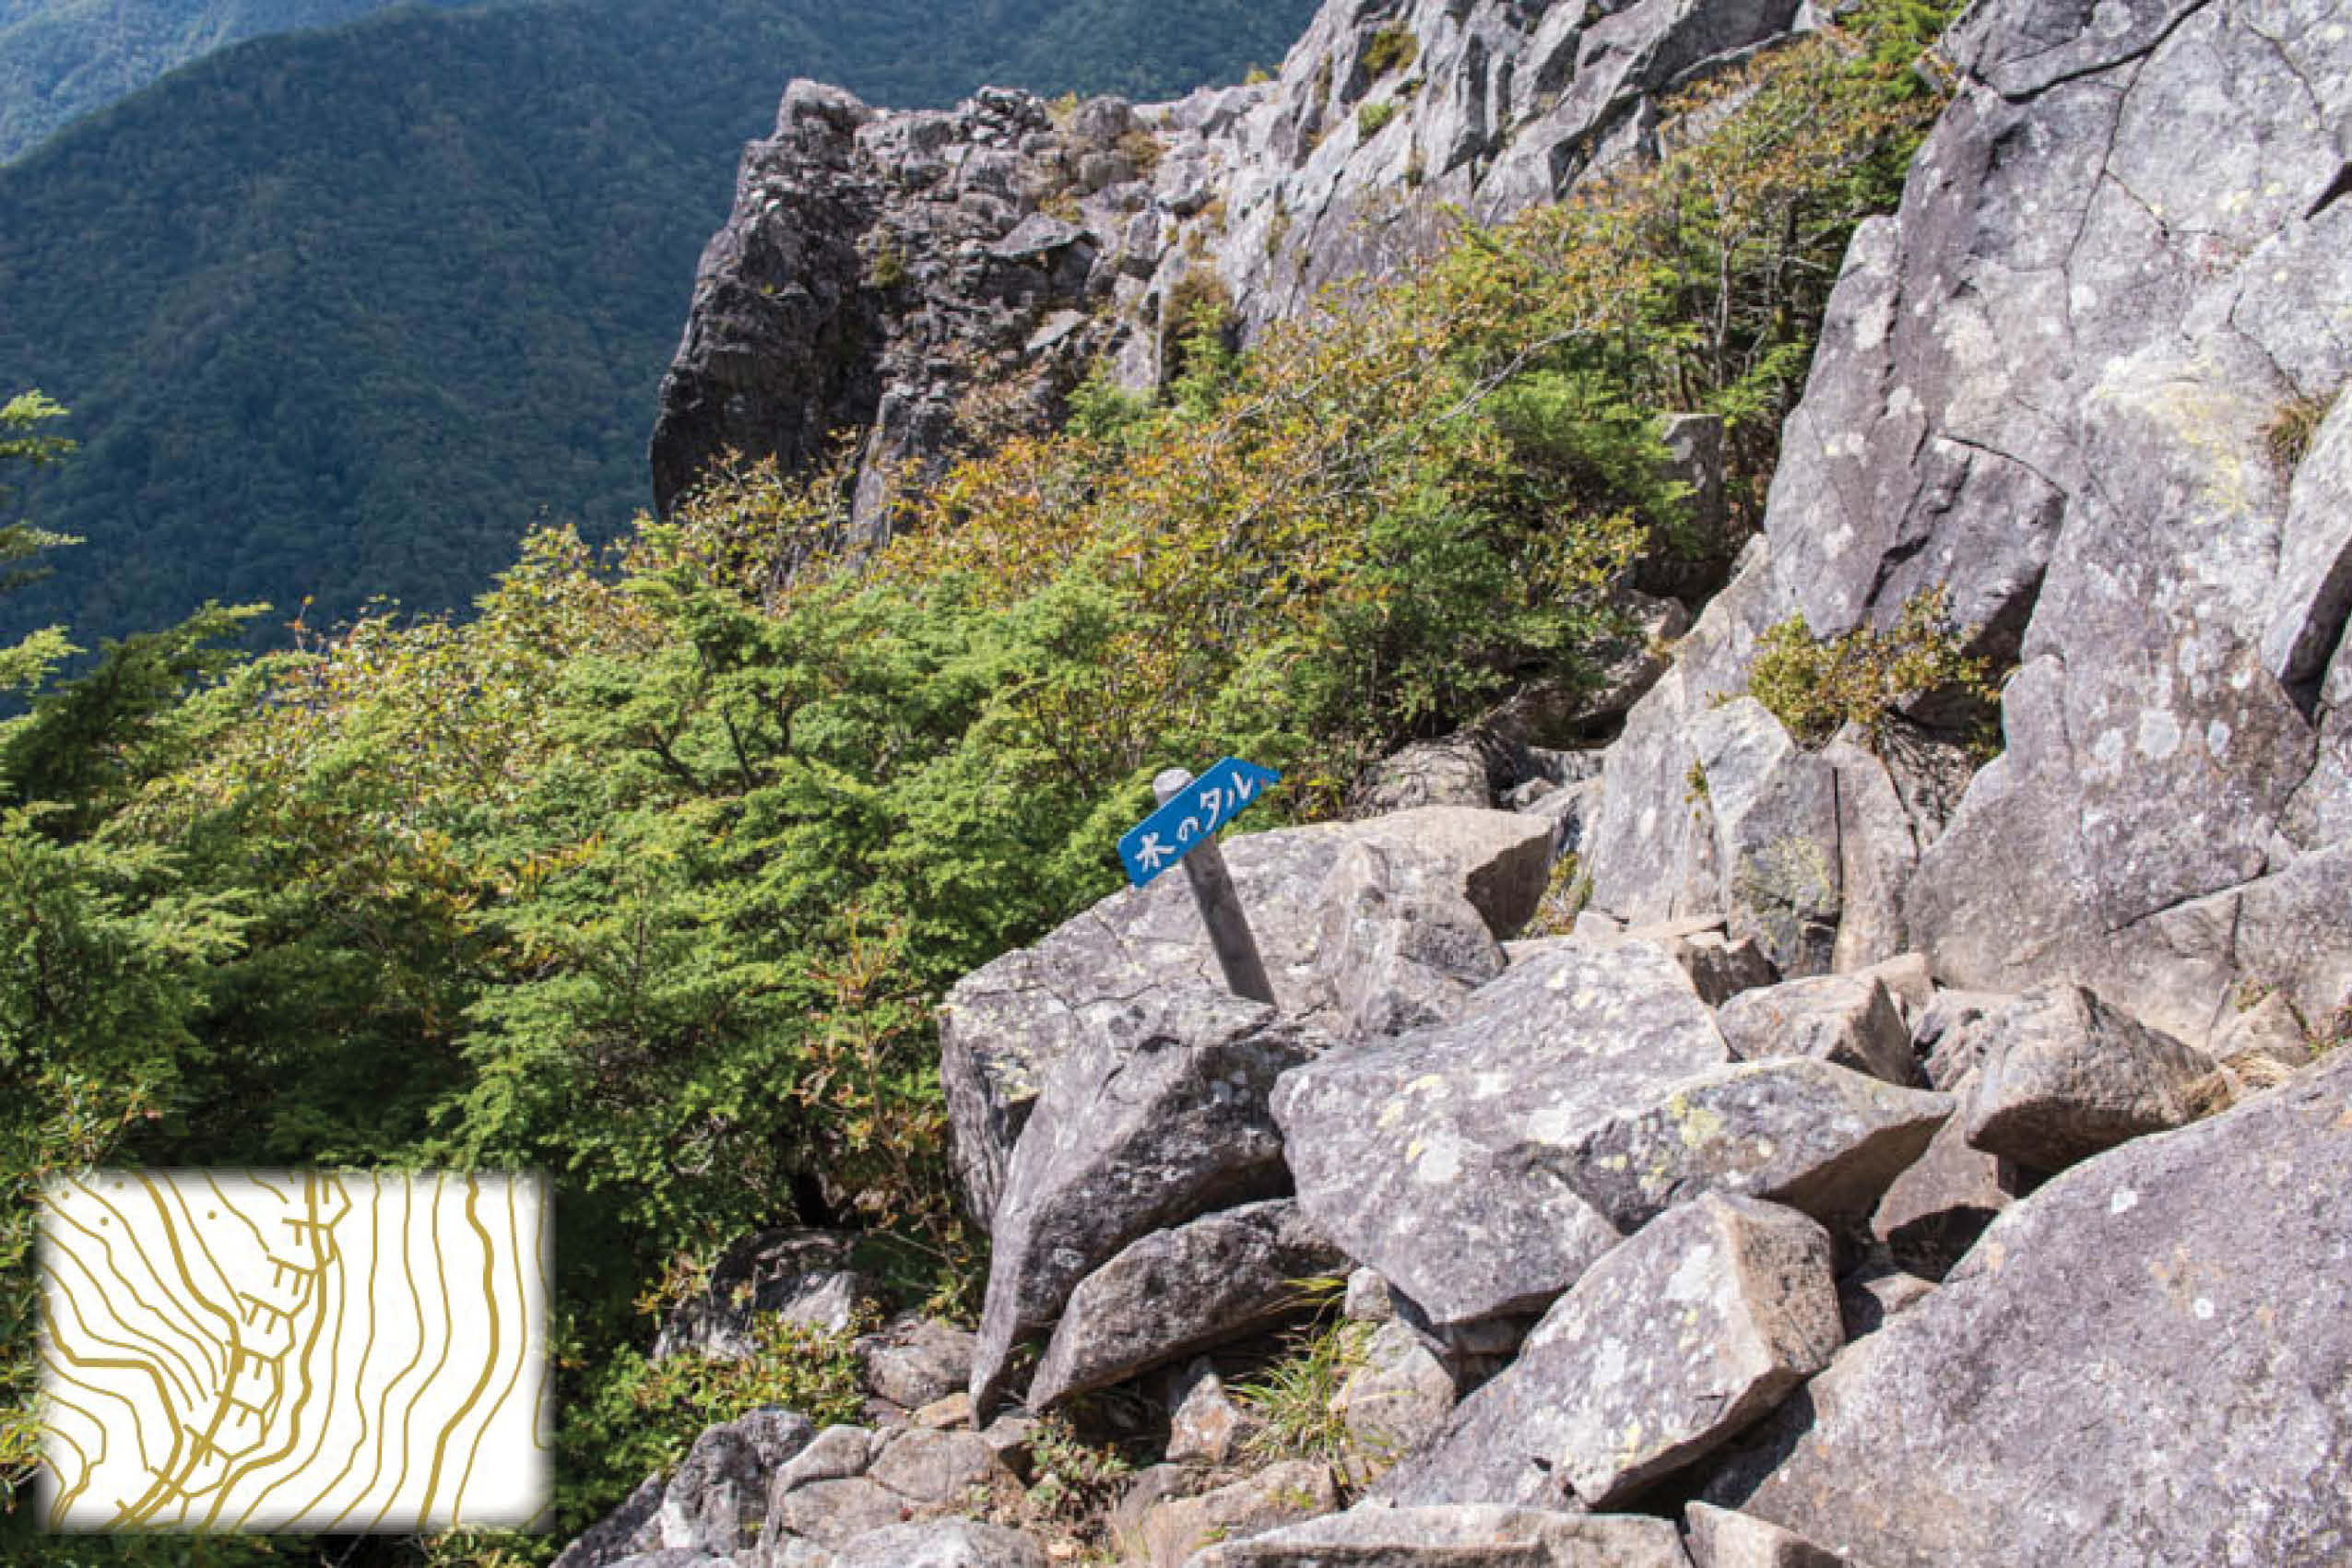
21. Mountain Path 徒歩道 tohodō
The standard dashed line symbolising a mountain path has a width of less than 1.5 metres. Note the veracity of mountain trails and branches can’t always be relied upon as they may be out of position or not actually exist. Check YamaReco and YAMAP for the latest mountain climbing conditions.
22. Road width less than 3 metres 幅員3.0m未満の道路
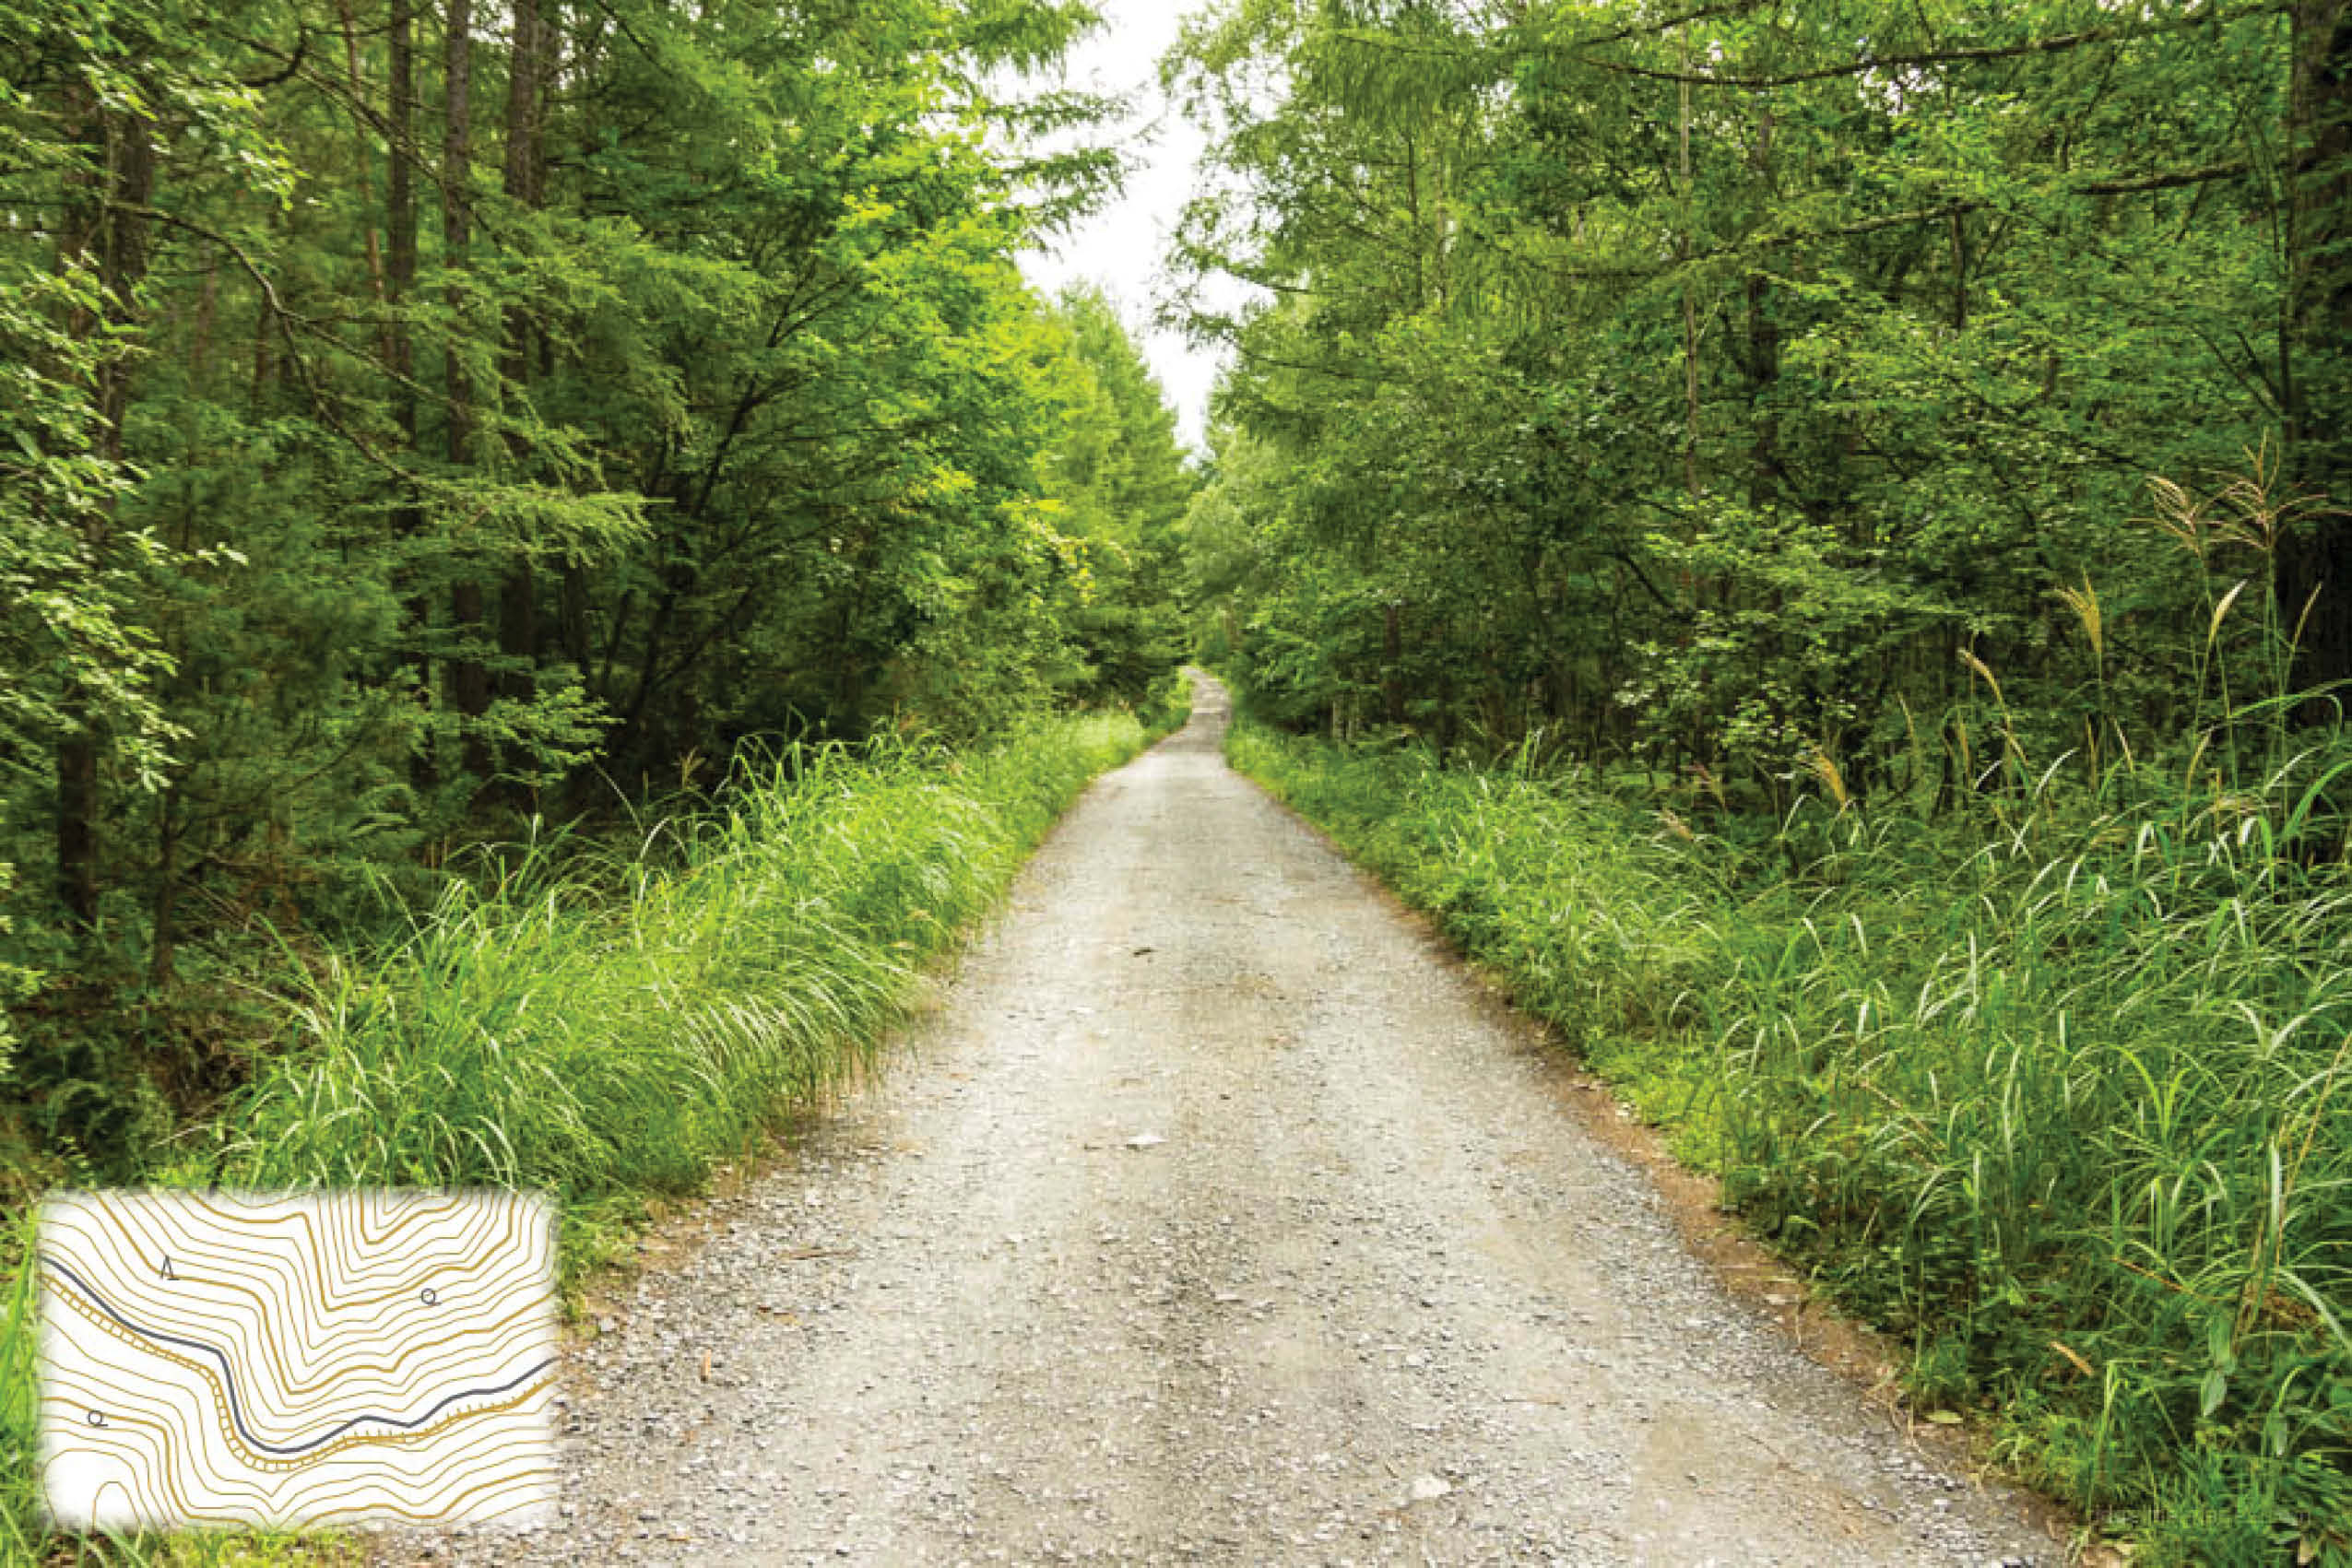
A fine black line indicates a road width of 1.5 to 3 metres. Normally these are forestry roads leading up to mountain trails some of which are paved and some of which are aren’t.
23. One-lane Road 一車線道路
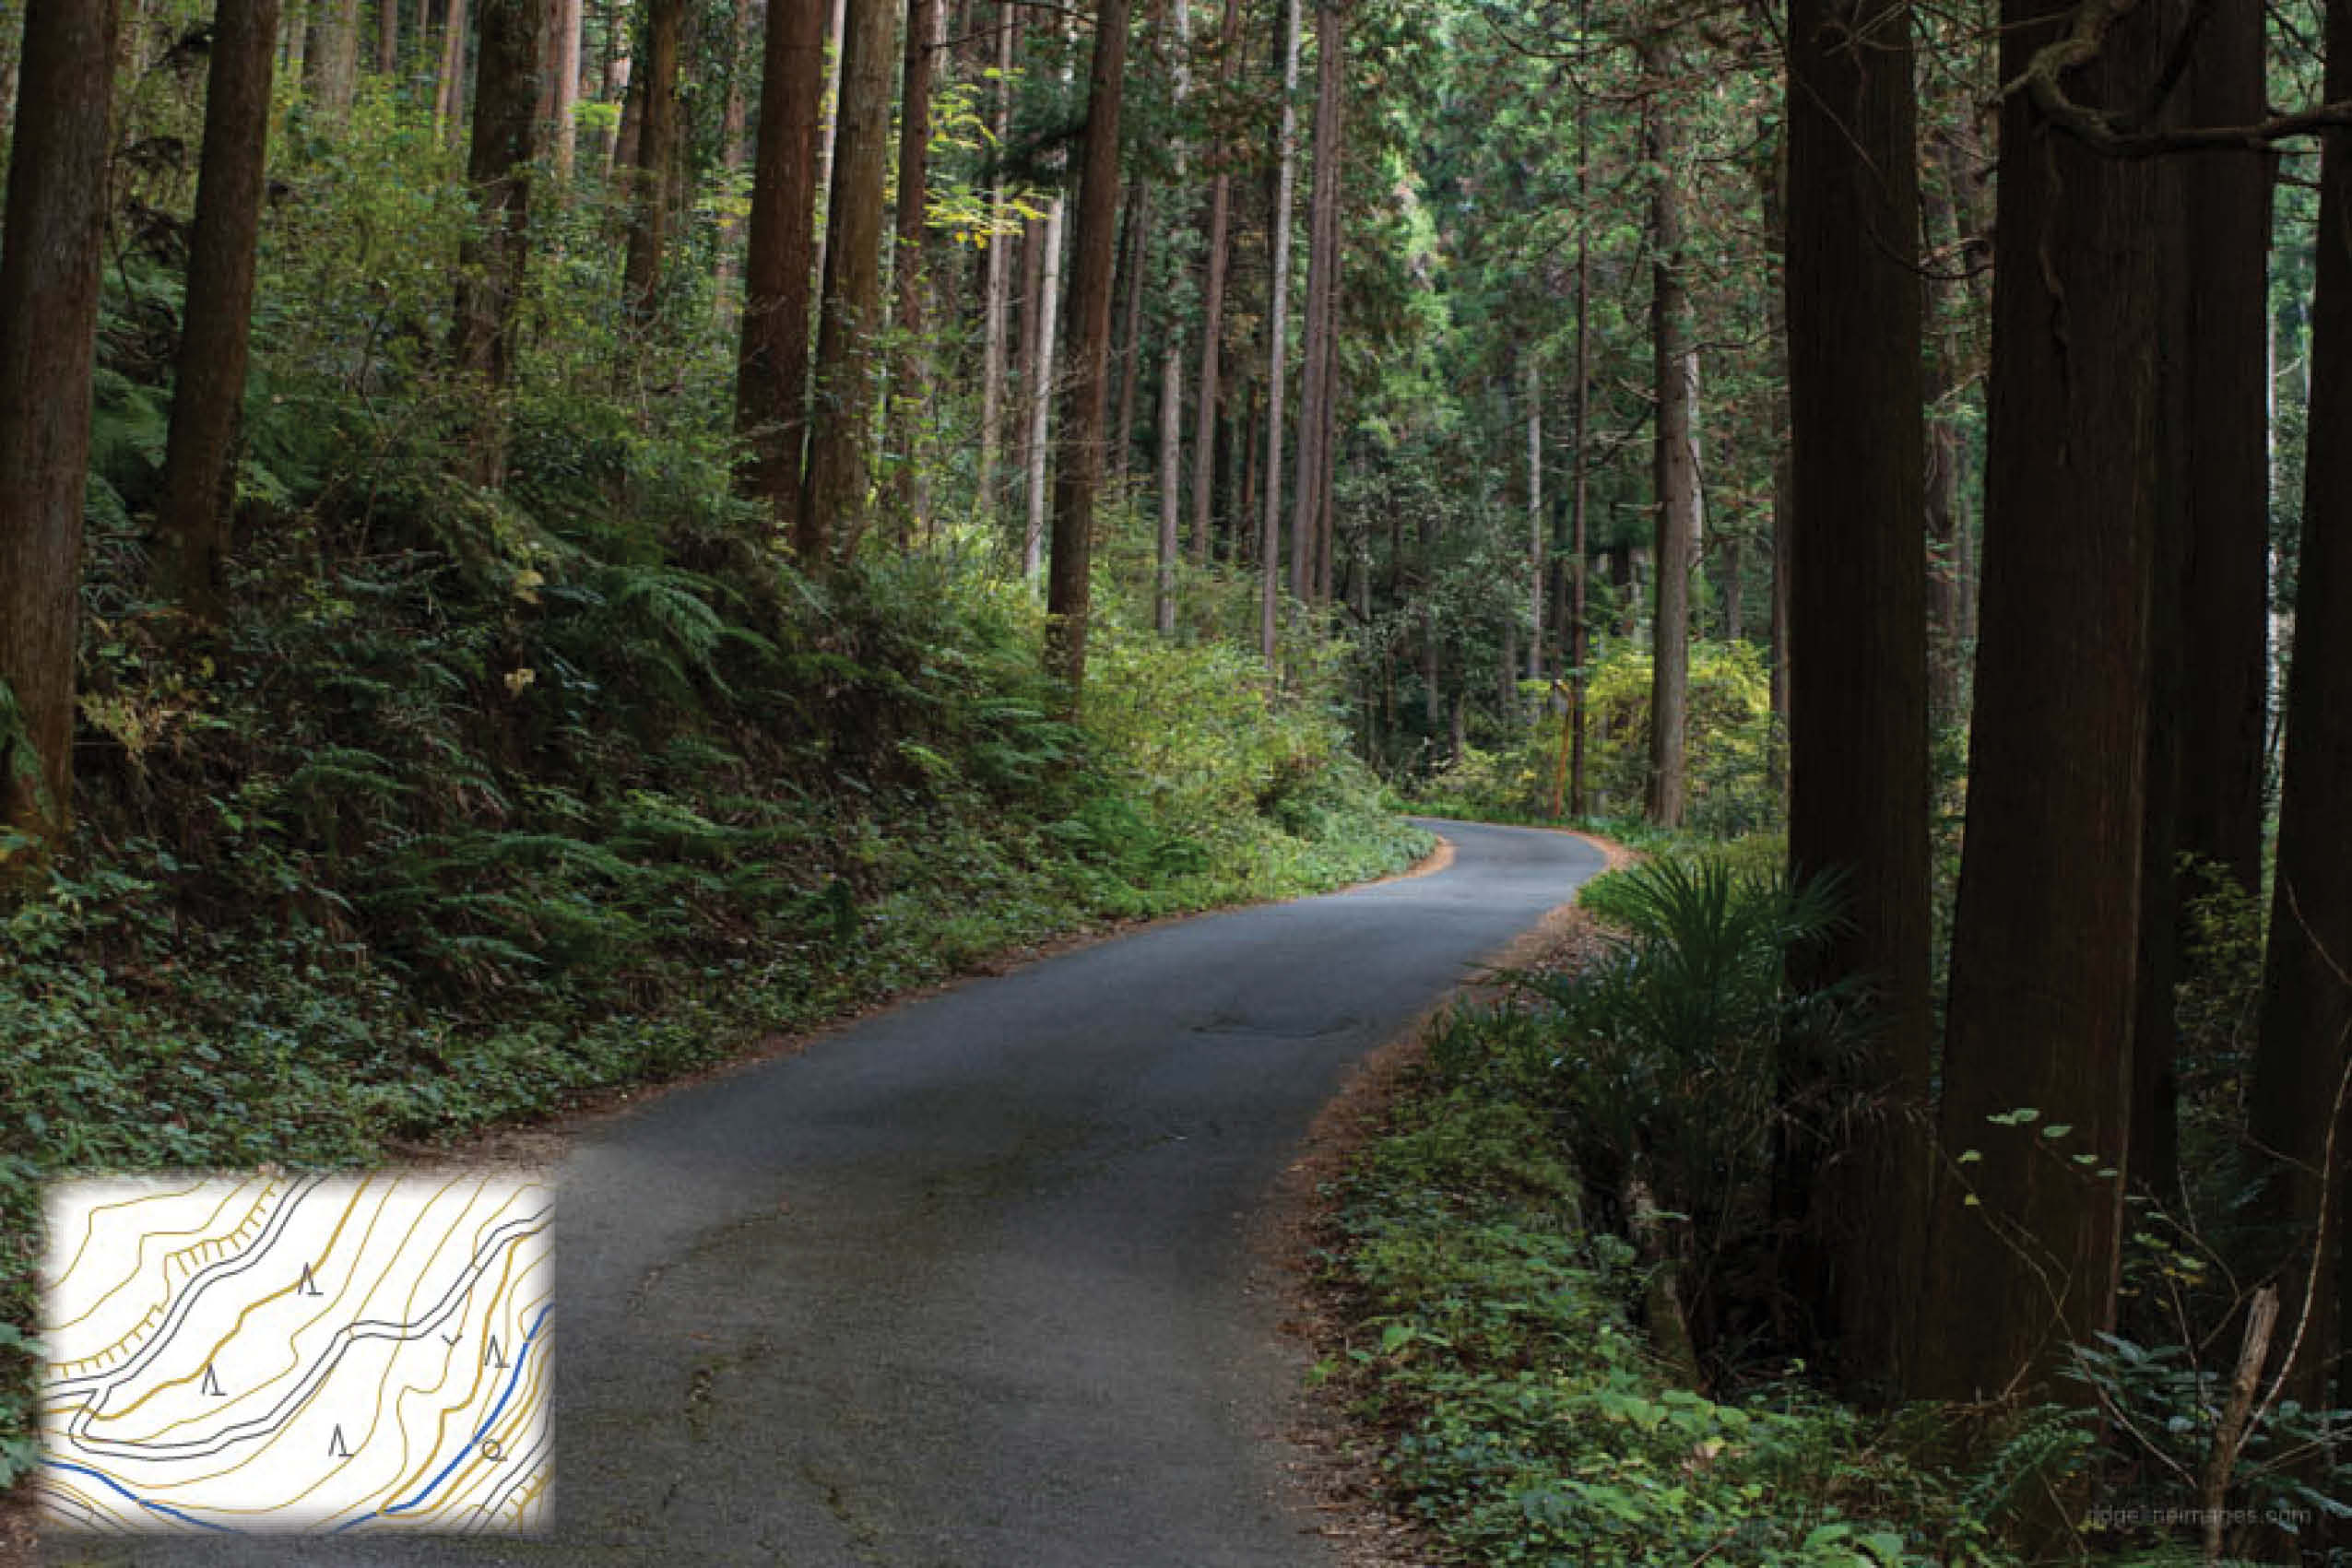
A step up in road hierarchy finds paved, one-lane roads. Frequently, these roads branch off, narrow or alternate between sealed and unsealed segments.
24. Aerial Lift ロープウェイ rōpuwei

This braided line shows the location of cables coupled to an aerial lift or “ropeway” such as cable cars, gondolas, and chairlifts. If the area around the ropeway is exposed, it can serve as a landmark for navigation.
Navigational Aids not Shown on GSI Maps
25. Rock Cairns ケルン
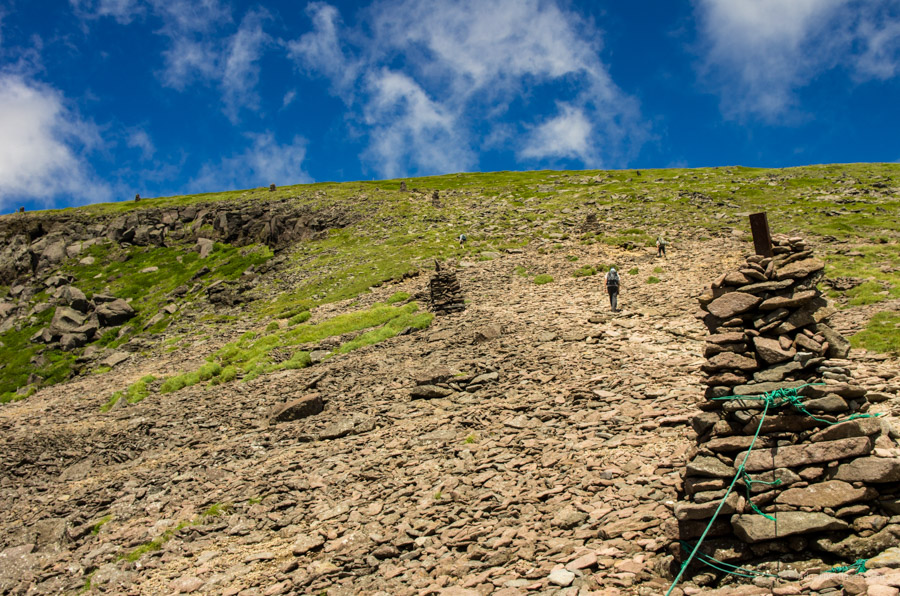
One final feature worth mentioning that isn’t marked on the GSI maps yet functions as a navigation aid are cairns or human-made stacks, mounds, or piles of rocks. They can be found on summits, along ridgelines and sometimes at trail branches.
— Map symbol inlays and feature image courtesy of Geospatial Information Authority of Japan (GSI)
This is great, David. That was a lot of work to put this together! I’ll have to put some dough in the coffee jar.
Thank you for the support Patrick 🙂
Good stuff, David. Thanks for writing this all out.
No prob Ian. Thanks for reading.
Hello,
Just in case! This map is included in the app ‘Geographica ’, for free, or a small fee for offline access. I don’t know how often it’s updated, but it is more reliable than open street maps in many situations I have encountered! Thanks for your blog!
Hi Yoso,
Appreciate the info on the Geographica app. You’re correct; the level of detail in GSI topographic maps within apps like Geographica surpasses what’s available on open street maps.
Brilliant article, thanks Dave.
The GSI link to a list of the legend symbols on their maps has changed to https://www.gsi.go.jp/common/000248794.pdf
a lot of copy and paste into Google translate needed!
Hi Phil, thanks for the comment. I’ve now updated the article with the link.
Thank you for the resource.
I wonder if you have a solution to another problem I’m facing. is there a way to state a grid reference location similar to UK OS grid on the GSI maps?
Thanks
The GSI uses a 7-digit grid system, often called the Japanese Grid System or JGD2011 grid, for referencing locations on their maps. While based on the Universal Transverse Mercator (UTM) projection, it’s a distinct system tailored to Japan.
This 7-digit grid reference pinpoints a location within a 1-metre square. The first three digits represent the Easting, and the last four represent the Northing, giving a location in metres within the Japanese grid. These are not directly equivalent to UTM Easting and Northing values.
A typical 7-digit grid reference is written as a single string of numbers, like “1234567”.
Because the UK Ordnance Survey grid and the Japanese Grid System use different projections, datums, and grid structures, there’s no simple formula for direct conversion. Accurate conversion requires specialised tools like the GSI’s own map viewer or third-party conversion services. These tools can handle the necessary transformations between coordinate systems.
David,
Thank you for your detailed reply. I have taken some time to digest it. but still cant apply this easily to the GSI Paper maps that I have bought from the book shops. There is a UTM scale on the maps. but no datum point or scale for 1km grid squares.
We could state locations in Lat Long. but this would require mixing NM and KM. Not a big issue. But also the printed maps don’t appear to have grid squares, making lining up of a grid ref more difficult.
Ideally I’d add a 1km grid to the maps so it can easily relate to the roma scale on a compass.
I cant imagine I am the first to experience difficulty with expressing a location extracted from the map as a grid ref / lat long. Have you found a simple to teach solution for this?
On marine charts, there is a grid and the minute scale is divided into sections to aid plotting. So these GSI maps seem to be printed with a different method in mind?
Thanks
Dan, you’ve hit on a common frustration with GSI paper maps, especially for those used to navigation charts with clear grid overlays. While the maps include a UTM scale, they often don’t have the 1km grid necessary for easily using the Japanese Grid System.
The main issue is that without those grid lines, it’s tough to determine a precise 7-digit reference directly from the map. The UTM markings help, but they’re usually spaced farther apart and don’t align perfectly with the Japanese Grid. Using latitude and longitude is an option, but as you pointed out, it introduces the mix of nautical miles and kilometres, which isn’t always ideal.
A Few Workarounds:
* GSI’s Online Map Viewer – The easiest way to get an accurate grid reference. You can find your location by lat/long or address, display the 1km grid, and get the 7-digit reference directly.
* Overlaying a 1km Grid – If you frequently use paper maps, a transparent overlay with a 1km grid is a good solution. GIS software like QGIS can help create one, or you could print a pre-made grid at the correct scale.
* Estimating with the UTM Grid – This is possible but not very precise. Without the 1km grid, you’d be making rough approximations within the larger UTM squares.
GSI maps differ from marine charts in that they prioritise topographic details over easy-to-use grid systems, assuming users will rely on digital tools for precision. If adding a 1km grid would improve usability, it might be worth reaching out to GSI to see if they offer maps with this feature.
For teaching a simple method, I’d suggest using GSI’s online tools to pinpoint locations and marking them manually on the paper map. If you regularly navigate with these maps, the overlay method is probably the most practical.
Thank you David.
Not the simple solution was was hopeful for. Looks like I’m going to be drawing grid lines on maps.
You have increased my understanding of the limitations and use of these maps.